Komitet Wyborczy Stronnictwa Demokratycznego
| Name: | Komitet Wyborczy Stronnictwa Demokratycznego | |
| Short name: | KW Stronnictwo Demokratyczne | |
| Type of committee: | Election committees established by political parties | |
| Address: | ul. Chmielna 9, 00-021, Warszawa | |
| Plenipotentiary: | electoral | financial |
| Marek Kucharski | Mirosław Tatarczuk | |
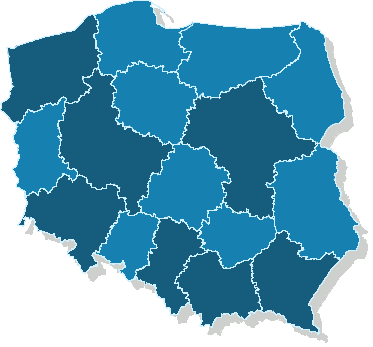
| Name |
|---|
| woj. dolnośląskie |
| woj. małopolskie |
| woj. mazowieckie |
| woj. podkarpackie |
| woj. śląskie |
| woj. wielkopolskie |
| woj. zachodniopomorskie |
The statistics of election committe
Lists submitted
| Description | Number of |
|---|---|
| Number of lists submitted for province council | 0 |
| Number of lists submitted for county councils | 1 |
| Number of lists submitted for councils of cities holding county rights | 4 |
| Number of lists submitted for districts councils of the cap. city of Warsaw | 0 |
| Number of lists registered for communal councils | 28 |
| Totalling | 33 |
Submitted candidates
| Name | Number of candidates | Women | Women (%) | Men | Men (%) |
|---|---|---|---|---|---|
| Number of candidates submitted for the province council | 0 | 0 | - | 0 | - |
| Number of candidates submitted for county councils | 8 | 2 | 25.00% | 6 | 75.00% |
| Number of candidates submitted for councils of cities holding county rights | 21 | 7 | 33.33% | 14 | 66.67% |
| Number of candidates submitted for districts councils of the cap. city of Warsaw | 0 | 0 | - | 0 | - |
| Number of candidates registered for communal councils | 72 | 18 | 25.00% | 54 | 75.00% |
| Number of candidates submitted for reeve, mayor and presidential elections | 3 | 0 | 0.00% | 3 | 100.00% |
| Totalling | 104 | 27 | 25.96% | 77 | 74.04% |
Average age of submitted candidates
| Name | Average age | Average age of women | Average age of men |
|---|---|---|---|
| Average age of candidates submitted for the province council | - | - | - |
| Average age of candidates submitted for county councils | 49 | 51 | 49 |
| Average age of candidates for councils of cities holding county rights | 48 | 41 | 52 |
| Average age of candidates for districts councils of the cap. city of Warsaw | - | - | - |
| Average age of candidates submitted for communal councils | 51 | 46 | 52 |
| Average age of candidates for reeve, mayor, president | 48 | - | 48 |
| Totalling | 50 | 45 | 52 |
Submitted candidates grouped by age
| Name | Number of candidates | Women | Women (%) | Men | Men (%) |
|---|---|---|---|---|---|
| 18-29 | 5 | 2 | 40.00% | 3 | 60.00% |
| 30-39 | 11 | 6 | 54.55% | 5 | 45.45% |
| 40-49 | 28 | 8 | 28.57% | 20 | 71.43% |
| 50-59 | 42 | 7 | 16.67% | 35 | 83.33% |
| 60-69 | 13 | 3 | 23.08% | 10 | 76.92% |
| 70+ | 5 | 1 | 20.00% | 4 | 80.00% |
The youngest and oldest candidate submitted
| Age | Institution | |
|---|---|---|
| Youngest | 18 | Rada Miejska w Skale |
| Oldest | 79 | Rada Miejska Jeleniej Góry |