Komitet Wyborczy Wyborców Obrona Narodu Polskiego
| Name: | Komitet Wyborczy Wyborców Obrona Narodu Polskiego | |
| Short name: | KWW ONP | |
| Type of committee: | Election committees established by electors | |
| Address: | ul. Dębowa 7/2, 40-104 Katowice | |
| Plenipotentiary: | electoral | financial |
| Tadeusz Wojciech Mazanek | Piotr Bubała | |
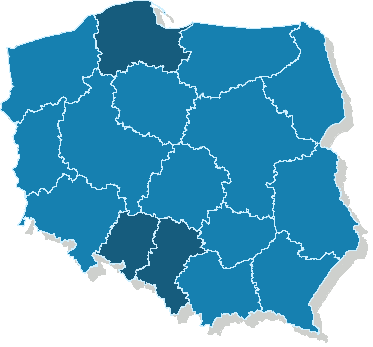
| Name |
|---|
| woj. opolskie |
| woj. pomorskie |
| woj. śląskie |
The statistics of election committe
Lists submitted
| Description | Number of |
|---|---|
| Number of lists submitted for province council | 15 |
| Number of lists submitted for county councils | 3 |
| Number of lists submitted for councils of cities holding county rights | 0 |
| Number of lists submitted for districts councils of the cap. city of Warsaw | 0 |
| Number of lists registered for communal councils | 19 |
| Totalling | 37 |
Submitted candidates
| Name | Number of candidates | Women | Women (%) | Men | Men (%) |
|---|---|---|---|---|---|
| Number of candidates submitted for the province council | 119 | 35 | 29.41% | 84 | 70.59% |
| Number of candidates submitted for county councils | 19 | 7 | 36.84% | 12 | 63.16% |
| Number of candidates submitted for councils of cities holding county rights | 0 | 0 | - | 0 | - |
| Number of candidates submitted for districts councils of the cap. city of Warsaw | 0 | 0 | - | 0 | - |
| Number of candidates registered for communal councils | 28 | 8 | 28.57% | 20 | 71.43% |
| Number of candidates submitted for reeve, mayor and presidential elections | 2 | 1 | 50.00% | 1 | 50.00% |
| Totalling | 168 | 51 | 30.36% | 117 | 69.64% |
Average age of submitted candidates
| Name | Average age | Average age of women | Average age of men |
|---|---|---|---|
| Average age of candidates submitted for the province council | 41 | 35 | 43 |
| Average age of candidates submitted for county councils | 40 | 40 | 41 |
| Average age of candidates for councils of cities holding county rights | - | - | - |
| Average age of candidates for districts councils of the cap. city of Warsaw | - | - | - |
| Average age of candidates submitted for communal councils | 38 | 30 | 41 |
| Average age of candidates for reeve, mayor, president | 35 | 36 | 35 |
| Totalling | 40 | 35 | 42 |
Submitted candidates grouped by age
| Name | Number of candidates | Women | Women (%) | Men | Men (%) |
|---|---|---|---|---|---|
| 18-29 | 38 | 17 | 44.74% | 21 | 55.26% |
| 30-39 | 43 | 18 | 41.86% | 25 | 58.14% |
| 40-49 | 39 | 10 | 25.64% | 29 | 74.36% |
| 50-59 | 38 | 6 | 15.79% | 32 | 84.21% |
| 60-69 | 7 | 0 | 0.00% | 7 | 100.00% |
| 70+ | 3 | 0 | 0.00% | 3 | 100.00% |
The youngest and oldest candidate submitted
| Age | Institution | |
|---|---|---|
| Youngest | 19 | Sejmik Województwa Śląskiego |
| Oldest | 71 | Sejmik Województwa Śląskiego |