Komitet Wyborczy Wyborców Wspólnota Powiatowa
| Name: | Komitet Wyborczy Wyborców Wspólnota Powiatowa | |
| Short name: | KWW Wspólnota Powiatowa | |
| Type of committee: | Election committees established by electors | |
| Address: | ul. Kościelna 6, 64-733 Drawsko | |
| Plenipotentiary: | electoral | financial |
| Ryszard Jabłonowski | Ewa Małgorzata Linka | |
The provinces where the committee has submitted lists of candidates
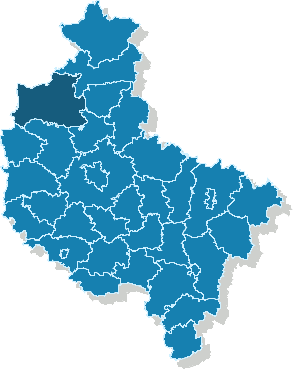
| Name |
|---|
| pow. czarnkowsko-trzcianecki |
The statistics of election committe
Lists submitted
| Description | Number of |
|---|---|
| Number of lists submitted for province council | 0 |
| Number of lists submitted for county councils | 5 |
| Number of lists submitted for councils of cities holding county rights | 0 |
| Number of lists submitted for districts councils of the cap. city of Warsaw | 0 |
| Number of lists registered for communal councils | 10 |
| Totalling | 15 |
Submitted candidates
| Name | Number of candidates | Women | Women (%) | Men | Men (%) |
|---|---|---|---|---|---|
| Number of candidates submitted for the province council | 0 | 0 | - | 0 | - |
| Number of candidates submitted for county councils | 39 | 10 | 25.64% | 29 | 74.36% |
| Number of candidates submitted for councils of cities holding county rights | 0 | 0 | - | 0 | - |
| Number of candidates submitted for districts councils of the cap. city of Warsaw | 0 | 0 | - | 0 | - |
| Number of candidates registered for communal councils | 23 | 6 | 26.09% | 17 | 73.91% |
| Number of candidates submitted for reeve, mayor and presidential elections | 1 | 0 | 0.00% | 1 | 100.00% |
| Totalling | 63 | 16 | 25.40% | 47 | 74.60% |
Average age of submitted candidates
| Name | Average age | Average age of women | Average age of men |
|---|---|---|---|
| Average age of candidates submitted for the province council | - | - | - |
| Average age of candidates submitted for county councils | 49 | 46 | 50 |
| Average age of candidates for councils of cities holding county rights | - | - | - |
| Average age of candidates for districts councils of the cap. city of Warsaw | - | - | - |
| Average age of candidates submitted for communal councils | 43 | 45 | 42 |
| Average age of candidates for reeve, mayor, president | 51 | - | 51 |
| Totalling | 47 | 46 | 47 |
Submitted candidates grouped by age
| Name | Number of candidates | Women | Women (%) | Men | Men (%) |
|---|---|---|---|---|---|
| 18-29 | 2 | 0 | 0.00% | 2 | 100.00% |
| 30-39 | 10 | 2 | 20.00% | 8 | 80.00% |
| 40-49 | 25 | 7 | 28.00% | 18 | 72.00% |
| 50-59 | 20 | 7 | 35.00% | 13 | 65.00% |
| 60-69 | 4 | 0 | 0.00% | 4 | 100.00% |
| 70+ | 2 | 0 | 0.00% | 2 | 100.00% |
The youngest and oldest candidate submitted
| Age | Institution | |
|---|---|---|
| Youngest | 26 | Rada Gminy w Drawsku |
| Oldest | 72 | Rada Powiatu Czarnkowsko-Trzcianeckiego |