Komitet Wyborczy Wyborców Blok 2006
| Name: | Komitet Wyborczy Wyborców Blok 2006 | |
| Short name: | KWW Blok 2006 | |
| Type of committee: | Election committees established by electors | |
| Address: | ul. Wroniecka 39A, 64-500 Szamotuły | |
| Plenipotentiary: | electoral | financial |
| Tadeusz Władysław Szymański | Krystyna Barbara Piotrowska | |
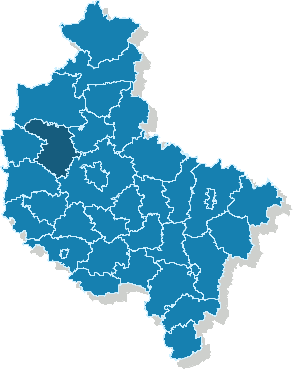
The provinces where the committee has submitted lists of candidates
| Name |
|---|
| pow. szamotulski |
The statistics of election committe
Lists submitted
| Description | Number of |
|---|---|
| Number of lists submitted for province council | 0 |
| Number of lists submitted for county councils | 4 |
| Number of lists submitted for councils of cities holding county rights | 0 |
| Number of lists submitted for districts councils of the cap. city of Warsaw | 0 |
| Number of lists registered for communal councils | 4 |
| Totalling | 8 |
Submitted candidates
| Name | Number of candidates | Women | Women (%) | Men | Men (%) |
|---|---|---|---|---|---|
| Number of candidates submitted for the province council | 0 | 0 | - | 0 | - |
| Number of candidates submitted for county councils | 19 | 4 | 21.05% | 15 | 78.95% |
| Number of candidates submitted for councils of cities holding county rights | 0 | 0 | - | 0 | - |
| Number of candidates submitted for districts councils of the cap. city of Warsaw | 0 | 0 | - | 0 | - |
| Number of candidates registered for communal councils | 39 | 9 | 23.08% | 30 | 76.92% |
| Number of candidates submitted for reeve, mayor and presidential elections | 1 | 0 | 0.00% | 1 | 100.00% |
| Totalling | 59 | 13 | 22.03% | 46 | 77.97% |
Average age of submitted candidates
| Name | Average age | Average age of women | Average age of men |
|---|---|---|---|
| Average age of candidates submitted for the province council | - | - | - |
| Average age of candidates submitted for county councils | 54 | 43 | 56 |
| Average age of candidates for councils of cities holding county rights | - | - | - |
| Average age of candidates for districts councils of the cap. city of Warsaw | - | - | - |
| Average age of candidates submitted for communal councils | 50 | 50 | 50 |
| Average age of candidates for reeve, mayor, president | 50 | - | 50 |
| Totalling | 51 | 48 | 52 |
Submitted candidates grouped by age
| Name | Number of candidates | Women | Women (%) | Men | Men (%) |
|---|---|---|---|---|---|
| 18-29 | 3 | 1 | 33.33% | 2 | 66.67% |
| 30-39 | 4 | 0 | 0.00% | 4 | 100.00% |
| 40-49 | 13 | 7 | 53.85% | 6 | 46.15% |
| 50-59 | 27 | 4 | 14.81% | 23 | 85.19% |
| 60-69 | 12 | 1 | 8.33% | 11 | 91.67% |
| 70+ | 0 | 0 | — | 0 | — |
The youngest and oldest candidate submitted
| Age | Institution | |
|---|---|---|
| Youngest | 22 | Rada Miasta i Gminy Szamotuły |
| Oldest | 67 | Rada Powiatu w Szamotułach |