Komitet Wyborczy Wyborców Warmińsko Mazurskiego Stronnictwa Gospodarczego
| Name: | Komitet Wyborczy Wyborców Warmińsko Mazurskiego Stronnictwa Gospodarczego | |
| Short name: | KWW Warm-Maz Stronnictwo Gospodarcze | |
| Type of committee: | Election committees established by electors | |
| Address: | ul. Westerplatte 1A Olsztyn | |
| Plenipotentiary: | electoral | financial |
| Marek Jarosław Kowalski | Marek Janusz Pierzynowski | |
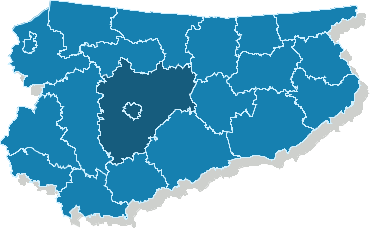
The provinces where the committee has submitted lists of candidates
| Name |
|---|
| m. Olsztyn |
| pow. olsztyński |
Sejmik Województwa Warmińsko-Mazurskiego
Submitted candidates
| Name | Number of candidates | Women | Women (%) | Men | Men (%) | Status |
|---|---|---|---|---|---|---|
| Sum: | 9 | 1 | 11.11% | 8 | 88.89% | |
| Constituency no. 1 | 6 | 1 | 16.67% | 5 | 83.33% |
|
| Constituency no. 2 | 3 | 0 | 0.00% | 3 | 100.00% |
List invalidated before the ballot cards have been printed
|
Age of the candidates
| Name | Average age | Average age of women | Average age of men | Oldest | Youngest |
|---|---|---|---|---|---|
| Constituency no. 1 | 51 | 68 | 47 | 68 | 33 |
| Constituency no. 2 | 50 | 50 | 63 | 30 |
The statistics of election committe
Lists submitted
| Description | Number of |
|---|---|
| Number of lists submitted for province council | 2 |
| Number of lists submitted for county councils | 1 |
| Number of lists submitted for councils of cities holding county rights | 4 |
| Number of lists submitted for districts councils of the cap. city of Warsaw | 0 |
| Number of lists registered for communal councils | 2 |
| Totalling | 9 |
Submitted candidates
| Name | Number of candidates | Women | Women (%) | Men | Men (%) |
|---|---|---|---|---|---|
| Number of candidates submitted for the province council | 9 | 1 | 11.11% | 8 | 88.89% |
| Number of candidates submitted for county councils | 3 | 0 | 0.00% | 3 | 100.00% |
| Number of candidates submitted for councils of cities holding county rights | 22 | 9 | 40.91% | 13 | 59.09% |
| Number of candidates submitted for districts councils of the cap. city of Warsaw | 0 | 0 | - | 0 | - |
| Number of candidates registered for communal councils | 2 | 1 | 50.00% | 1 | 50.00% |
| Number of candidates submitted for reeve, mayor and presidential elections | 0 | 0 | - | 0 | - |
| Totalling | 36 | 11 | 30.56% | 25 | 69.44% |
Average age of submitted candidates
| Name | Average age | Average age of women | Average age of men |
|---|---|---|---|
| Average age of candidates submitted for the province council | 50 | 68 | 48 |
| Average age of candidates submitted for county councils | 47 | - | 47 |
| Average age of candidates for councils of cities holding county rights | 37 | 37 | 37 |
| Average age of candidates for districts councils of the cap. city of Warsaw | - | - | - |
| Average age of candidates submitted for communal councils | 43 | 49 | 38 |
| Average age of candidates for reeve, mayor, president | - | - | - |
| Totalling | 42 | 41 | 42 |
Submitted candidates grouped by age
| Name | Number of candidates | Women | Women (%) | Men | Men (%) |
|---|---|---|---|---|---|
| 18-29 | 4 | 0 | 0.00% | 4 | 100.00% |
| 30-39 | 10 | 5 | 50.00% | 5 | 50.00% |
| 40-49 | 14 | 5 | 35.71% | 9 | 64.29% |
| 50-59 | 4 | 0 | 0.00% | 4 | 100.00% |
| 60-69 | 4 | 1 | 25.00% | 3 | 75.00% |
| 70+ | 0 | 0 | — | 0 | — |
The youngest and oldest candidate submitted
| Age | Institution | |
|---|---|---|
| Youngest | 20 | Rada Miasta Olsztyn |
| Oldest | 68 | Sejmik Województwa Warmińsko-Mazurskiego |