Komitet Wyborczy Mniejszość Niemiecka
| Name: | Komitet Wyborczy Mniejszość Niemiecka | |
| Short name: | Komitet Wyborczy Mniejszość Niemiecka | |
| Type of committee: | Election committees established by organisations | |
| Address: | ul. M.Konopnickiej 6 45-004 Opole | |
| Plenipotentiary: | electoral | financial |
| Ryszard Hubert Donitza | Maria Józefa Heinz | |
The provinces where the committee has submitted lists of candidates
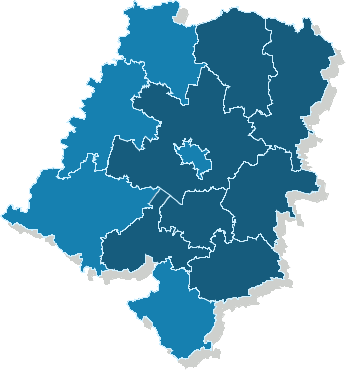
| Name |
|---|
| pow. kędzierzyńsko-kozielski |
| pow. kluczborski |
| pow. krapkowicki |
| pow. oleski |
| pow. opolski |
| pow. prudnicki |
| pow. strzelecki |
Sejmik Województwa Opolskiego
Submitted candidates
| Name | Number of candidates | Women | Women (%) | Men | Men (%) | Status |
|---|---|---|---|---|---|---|
| Sum: | 28 | 4 | 14.29% | 24 | 85.71% | |
| Constituency no. 1 | 7 | 1 | 14.29% | 6 | 85.71% |
|
| Constituency no. 2 | 6 | 1 | 16.67% | 5 | 83.33% |
|
| Constituency no. 3 | 8 | 1 | 12.50% | 7 | 87.50% |
|
| Constituency no. 4 | 7 | 1 | 14.29% | 6 | 85.71% |
|
Age of the candidates
| Name | Average age | Average age of women | Average age of men | Oldest | Youngest |
|---|---|---|---|---|---|
| Constituency no. 1 | 49 | 53 | 48 | 70 | 30 |
| Constituency no. 2 | 49 | 48 | 50 | 58 | 45 |
| Constituency no. 3 | 46 | 40 | 47 | 70 | 40 |
| Constituency no. 4 | 56 | 65 | 55 | 65 | 37 |
The statistics of election committe
Lists submitted
| Description | Number of |
|---|---|
| Number of lists submitted for province council | 4 |
| Number of lists submitted for county councils | 26 |
| Number of lists submitted for councils of cities holding county rights | 0 |
| Number of lists submitted for districts councils of the cap. city of Warsaw | 0 |
| Number of lists registered for communal councils | 271 |
| Totalling | 301 |
Submitted candidates
| Name | Number of candidates | Women | Women (%) | Men | Men (%) |
|---|---|---|---|---|---|
| Number of candidates submitted for the province council | 28 | 4 | 14.29% | 24 | 85.71% |
| Number of candidates submitted for county councils | 158 | 41 | 25.95% | 117 | 74.05% |
| Number of candidates submitted for councils of cities holding county rights | 0 | 0 | - | 0 | - |
| Number of candidates submitted for districts councils of the cap. city of Warsaw | 0 | 0 | - | 0 | - |
| Number of candidates registered for communal councils | 511 | 141 | 27.59% | 370 | 72.41% |
| Number of candidates submitted for reeve, mayor and presidential elections | 32 | 6 | 18.75% | 26 | 81.25% |
| Totalling | 729 | 192 | 26.34% | 537 | 73.66% |
Average age of submitted candidates
| Name | Average age | Average age of women | Average age of men |
|---|---|---|---|
| Average age of candidates submitted for the province council | 50 | 51 | 50 |
| Average age of candidates submitted for county councils | 48 | 44 | 50 |
| Average age of candidates for councils of cities holding county rights | - | - | - |
| Average age of candidates for districts councils of the cap. city of Warsaw | - | - | - |
| Average age of candidates submitted for communal councils | 48 | 46 | 49 |
| Average age of candidates for reeve, mayor, president | 48 | 45 | 49 |
| Totalling | 48 | 46 | 49 |
Submitted candidates grouped by age
| Name | Number of candidates | Women | Women (%) | Men | Men (%) |
|---|---|---|---|---|---|
| 18-29 | 31 | 12 | 38.71% | 19 | 61.29% |
| 30-39 | 110 | 32 | 29.09% | 78 | 70.91% |
| 40-49 | 259 | 78 | 30.12% | 181 | 69.88% |
| 50-59 | 210 | 56 | 26.67% | 154 | 73.33% |
| 60-69 | 95 | 14 | 14.74% | 81 | 85.26% |
| 70+ | 24 | 0 | 0.00% | 24 | 100.00% |
The youngest and oldest candidate submitted
| Age | Institution | |
|---|---|---|
| Youngest | 19 | Rada Miasta Kędzierzyn-Koźle |
| Oldest | 75 | Rada Gminy Radłów |