Komitet Wyborczy Samoobrona Rzeczpospolitej Polskiej
| Name: | Komitet Wyborczy Samoobrona Rzeczpospolitej Polskiej | |
| Short name: | KW Samoobrona RP | |
| Type of committee: | Election committees established by political parties | |
| Address: | Al. Jerozolimskie 30, 00-024 Warszawa | |
| Plenipotentiary: | electoral | financial |
| Krzysztof Filipek | Halina Sikorska | |
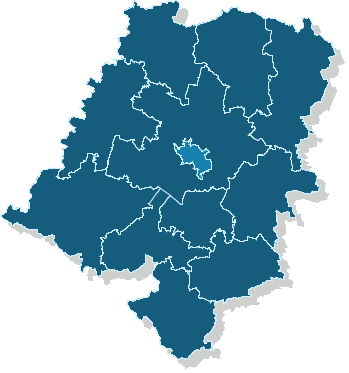
The provinces where the committee has submitted lists of candidates
| Name |
|---|
| pow. brzeski |
| pow. głubczycki |
| pow. kędzierzyńsko-kozielski |
| pow. kluczborski |
| pow. krapkowicki |
| pow. namysłowski |
| pow. nyski |
| pow. oleski |
| pow. opolski |
| pow. prudnicki |
| pow. strzelecki |
Sejmik Województwa Opolskiego
Submitted candidates
| Name | Number of candidates | Women | Women (%) | Men | Men (%) | Status |
|---|---|---|---|---|---|---|
| Sum: | 47 | 14 | 29.79% | 33 | 70.21% | |
| Constituency no. 1 | 10 | 2 | 20.00% | 8 | 80.00% |
|
| Constituency no. 2 | 11 | 5 | 45.45% | 6 | 54.55% |
|
| Constituency no. 3 | 7 | 4 | 57.14% | 3 | 42.86% |
|
| Constituency no. 4 | 7 | 2 | 28.57% | 5 | 71.43% |
|
| Constituency no. 5 | 12 | 1 | 8.33% | 11 | 91.67% |
|
Age of the candidates
| Name | Average age | Average age of women | Average age of men | Oldest | Youngest |
|---|---|---|---|---|---|
| Constituency no. 1 | 49 | 33 | 53 | 66 | 24 |
| Constituency no. 2 | 40 | 37 | 43 | 68 | 18 |
| Constituency no. 3 | 41 | 45 | 36 | 69 | 19 |
| Constituency no. 4 | 54 | 41 | 59 | 77 | 22 |
| Constituency no. 5 | 40 | 25 | 42 | 63 | 25 |
The statistics of election committe
Lists submitted
| Description | Number of |
|---|---|
| Number of lists submitted for province council | 5 |
| Number of lists submitted for county councils | 29 |
| Number of lists submitted for councils of cities holding county rights | 0 |
| Number of lists registered for communal councils | 100 |
| Totalling | 134 |
Submitted candidates
| Name | Number of candidates | Women | Women (%) | Men | Men (%) |
|---|---|---|---|---|---|
| Number of candidates submitted for the province council | 47 | 14 | 29.79% | 33 | 70.21% |
| Number of candidates submitted for county councils | 153 | 41 | 26.80% | 112 | 73.20% |
| Number of candidates submitted for councils of cities holding county rights | 0 | 0 | - | 0 | - |
| Number of candidates registered for communal councils | 260 | 95 | 36.54% | 165 | 63.46% |
| Number of candidates submitted for reeve, mayor and presidential elections | 8 | 2 | 25.00% | 6 | 75.00% |
| Totalling | 468 | 152 | 32.48% | 316 | 67.52% |
Average age of submitted candidates
| Name | Average age | Average age of women | Average age of men |
|---|---|---|---|
| Average age of candidates submitted for the province council | 44 | 38 | 47 |
| Average age of candidates submitted for county councils | 45 | 44 | 46 |
| Average age of candidates for councils of cities holding county rights | - | - | - |
| Average age of candidates submitted for communal councils | 45 | 44 | 46 |
| Average age of candidates for reeve, mayor, president | 50 | 44 | 52 |
| Totalling | 45 | 43 | 46 |
Submitted candidates grouped by age
| Name | Number of candidates | Women | Women (%) | Men | Men (%) |
|---|---|---|---|---|---|
| 18-29 | 74 | 30 | 40.54% | 44 | 59.46% |
| 30-39 | 67 | 24 | 35.82% | 43 | 64.18% |
| 40-49 | 109 | 37 | 33.94% | 72 | 66.06% |
| 50-59 | 157 | 43 | 27.39% | 114 | 72.61% |
| 60-69 | 52 | 17 | 32.69% | 35 | 67.31% |
| 70+ | 9 | 1 | 11.11% | 8 | 88.89% |
The youngest and oldest candidate submitted
| Age | Institution | |
|---|---|---|
| Youngest | 18 | Rada Miejska w Grodkowie |
| Oldest | 77 | Sejmik Województwa Opolskiego |