Koalicyjny Komitet Wyborczy SLD+SDPL+PD+UP Lewica i Demokraci
| Name: | Koalicyjny Komitet Wyborczy SLD+SDPL+PD+UP Lewica i Demokraci | |
| Short name: | KKW SLD+SDPL+PD+UP Lewica i Demokraci | |
| Type of committee: | Election committees established by coalitions | |
| Address: | ul. Rozbrat 44a, 00-419 Warszawa | |
| Plenipotentiary: | electoral | financial |
| Michał Tober | Edward Kuczera | |
The provinces where the committee has submitted lists of candidates
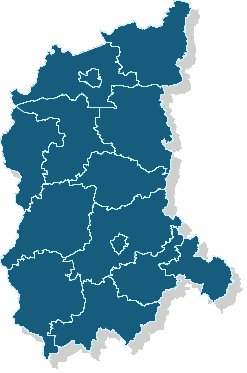
Sejmik Województwa Lubuskiego
Submitted candidates
| Name | Number of candidates | Women | Women (%) | Men | Men (%) | Status |
|---|---|---|---|---|---|---|
| Sum: | 56 | 5 | 8.93% | 51 | 91.07% | |
| Constituency no. 1 | 14 | 2 | 14.29% | 12 | 85.71% |
|
| Constituency no. 2 | 11 | 1 | 9.09% | 10 | 90.91% |
|
| Constituency no. 3 | 9 | 0 | 0.00% | 9 | 100.00% |
|
| Constituency no. 4 | 12 | 1 | 8.33% | 11 | 91.67% |
|
| Constituency no. 5 | 10 | 1 | 10.00% | 9 | 90.00% |
|
Age of the candidates
| Name | Average age | Average age of women | Average age of men | Oldest | Youngest |
|---|---|---|---|---|---|
| Constituency no. 1 | 48 | 43 | 49 | 69 | 26 |
| Constituency no. 2 | 43 | 30 | 45 | 66 | 26 |
| Constituency no. 3 | 52 | 52 | 65 | 39 | |
| Constituency no. 4 | 53 | 52 | 53 | 73 | 28 |
| Constituency no. 5 | 52 | 55 | 51 | 65 | 29 |
The statistics of election committe
Lists submitted
| Description | Number of |
|---|---|
| Number of lists submitted for province council | 5 |
| Number of lists submitted for county councils | 43 |
| Number of lists submitted for councils of cities holding county rights | 10 |
| Number of lists registered for communal councils | 175 |
| Totalling | 233 |
Submitted candidates
| Name | Number of candidates | Women | Women (%) | Men | Men (%) |
|---|---|---|---|---|---|
| Number of candidates submitted for the province council | 56 | 5 | 8.93% | 51 | 91.07% |
| Number of candidates submitted for county councils | 379 | 95 | 25.07% | 284 | 74.93% |
| Number of candidates submitted for councils of cities holding county rights | 99 | 20 | 20.20% | 79 | 79.80% |
| Number of candidates registered for communal councils | 535 | 135 | 25.23% | 400 | 74.77% |
| Number of candidates submitted for reeve, mayor and presidential elections | 13 | 1 | 7.69% | 12 | 92.31% |
| Totalling | 1,082 | 256 | 23.66% | 826 | 76.34% |
Average age of submitted candidates
| Name | Average age | Average age of women | Average age of men |
|---|---|---|---|
| Average age of candidates submitted for the province council | 49 | 44 | 50 |
| Average age of candidates submitted for county councils | 50 | 47 | 52 |
| Average age of candidates for councils of cities holding county rights | 47 | 44 | 48 |
| Average age of candidates submitted for communal councils | 48 | 46 | 49 |
| Average age of candidates for reeve, mayor, president | 50 | 57 | 49 |
| Totalling | 49 | 46 | 50 |
Submitted candidates grouped by age
| Name | Number of candidates | Women | Women (%) | Men | Men (%) |
|---|---|---|---|---|---|
| 18-29 | 90 | 24 | 26.67% | 66 | 73.33% |
| 30-39 | 146 | 44 | 30.14% | 102 | 69.86% |
| 40-49 | 221 | 68 | 30.77% | 153 | 69.23% |
| 50-59 | 435 | 96 | 22.07% | 339 | 77.93% |
| 60-69 | 160 | 22 | 13.75% | 138 | 86.25% |
| 70+ | 30 | 2 | 6.67% | 28 | 93.33% |
The youngest and oldest candidate submitted
| Age | Institution | |
|---|---|---|
| Youngest | 19 | Rada Gminy Otyń |
| Oldest | 83 | Rada Miejska w Sulechowie |