Koalicyjny Komitet Wyborczy SLD+SDPL+PD+UP Lewica i Demokraci
| Name: | Koalicyjny Komitet Wyborczy SLD+SDPL+PD+UP Lewica i Demokraci | |
| Short name: | KKW SLD+SDPL+PD+UP Lewica i Demokraci | |
| Type of committee: | Election committees established by coalitions | |
| Address: | ul. Rozbrat 44a, 00-419 Warszawa | |
| Plenipotentiary: | electoral | financial |
| Michał Tober | Edward Kuczera | |
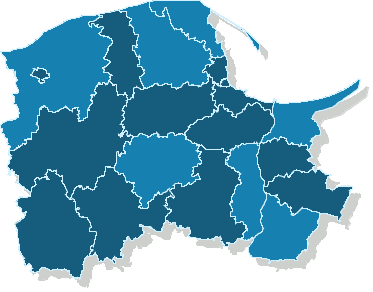
The provinces where the committee has submitted lists of candidates
| Name |
|---|
| m. Gdańsk |
| m. Gdynia |
| m. Słupsk |
| m. Sopot |
| pow. bytowski |
| pow. chojnicki |
| pow. człuchowski |
| pow. gdański |
| pow. kartuski |
| pow. lęborski |
| pow. malborski |
| pow. starogardzki |
| pow. sztumski |
Sejmik Województwa Pomorskiego
Submitted candidates
| Name | Number of candidates | Women | Women (%) | Men | Men (%) | Status |
|---|---|---|---|---|---|---|
| Sum: | 46 | 10 | 21.74% | 36 | 78.26% | |
| Constituency no. 1 | 8 | 1 | 12.50% | 7 | 87.50% |
|
| Constituency no. 2 | 10 | 2 | 20.00% | 8 | 80.00% |
|
| Constituency no. 3 | 11 | 3 | 27.27% | 8 | 72.73% |
|
| Constituency no. 4 | 8 | 3 | 37.50% | 5 | 62.50% |
|
| Constituency no. 5 | 9 | 1 | 11.11% | 8 | 88.89% |
|
Age of the candidates
| Name | Average age | Average age of women | Average age of men | Oldest | Youngest |
|---|---|---|---|---|---|
| Constituency no. 1 | 48 | 46 | 48 | 58 | 27 |
| Constituency no. 2 | 46 | 27 | 51 | 68 | 22 |
| Constituency no. 3 | 48 | 52 | 47 | 70 | 21 |
| Constituency no. 4 | 51 | 44 | 55 | 70 | 25 |
| Constituency no. 5 | 46 | 22 | 49 | 69 | 22 |
The statistics of election committe
Lists submitted
| Description | Number of |
|---|---|
| Number of lists submitted for province council | 5 |
| Number of lists submitted for county councils | 28 |
| Number of lists submitted for councils of cities holding county rights | 17 |
| Number of lists registered for communal councils | 88 |
| Totalling | 138 |
Submitted candidates
| Name | Number of candidates | Women | Women (%) | Men | Men (%) |
|---|---|---|---|---|---|
| Number of candidates submitted for the province council | 46 | 10 | 21.74% | 36 | 78.26% |
| Number of candidates submitted for county councils | 194 | 54 | 27.84% | 140 | 72.16% |
| Number of candidates submitted for councils of cities holding county rights | 165 | 42 | 25.45% | 123 | 74.55% |
| Number of candidates registered for communal councils | 238 | 83 | 34.87% | 155 | 65.13% |
| Number of candidates submitted for reeve, mayor and presidential elections | 11 | 2 | 18.18% | 9 | 81.82% |
| Totalling | 654 | 191 | 29.20% | 463 | 70.80% |
Average age of submitted candidates
| Name | Average age | Average age of women | Average age of men |
|---|---|---|---|
| Average age of candidates submitted for the province council | 47 | 41 | 49 |
| Average age of candidates submitted for county councils | 50 | 47 | 52 |
| Average age of candidates for councils of cities holding county rights | 46 | 50 | 44 |
| Average age of candidates submitted for communal councils | 47 | 45 | 48 |
| Average age of candidates for reeve, mayor, president | 53 | 49 | 54 |
| Totalling | 48 | 47 | 48 |
Submitted candidates grouped by age
| Name | Number of candidates | Women | Women (%) | Men | Men (%) |
|---|---|---|---|---|---|
| 18-29 | 72 | 16 | 22.22% | 56 | 77.78% |
| 30-39 | 90 | 34 | 37.78% | 56 | 62.22% |
| 40-49 | 146 | 51 | 34.93% | 95 | 65.07% |
| 50-59 | 226 | 70 | 30.97% | 156 | 69.03% |
| 60-69 | 102 | 18 | 17.65% | 84 | 82.35% |
| 70+ | 18 | 2 | 11.11% | 16 | 88.89% |
The youngest and oldest candidate submitted
| Age | Institution | |
|---|---|---|
| Youngest | 18 | Rada Miasta Gdyni |
| Oldest | 78 | Rada Miasta Malborka |