Komitet Wyborczy Wyborców z Ludźmi - dla Ludzi
| Name: | Komitet Wyborczy Wyborców z Ludźmi - dla Ludzi | |
| Short name: | KWW z Ludźmi - dla Ludzi | |
| Type of committee: | Election committees established by electors | |
| Address: | ul. Wilczyńskiego 3, 08-300 Sokołów Podlaski | |
| Plenipotentiary: | electoral | financial |
| Jerzy Oleszczuk | Witold Wyszomirski | |
The provinces where the committee has submitted lists of candidates
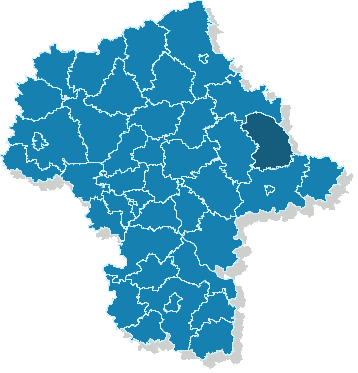
| Name |
|---|
| pow. sokołowski |
The statistics of election committe
Lists submitted
| Description | Number of |
|---|---|
| Number of lists submitted for province council | 0 |
| Number of lists submitted for county councils | 5 |
| Number of lists submitted for councils of cities holding county rights | 0 |
| Number of lists submitted for districts councils of the cap. city of Warsaw | 0 |
| Number of lists registered for communal councils | 23 |
| Totalling | 28 |
Submitted candidates
| Name | Number of candidates | Women | Women (%) | Men | Men (%) |
|---|---|---|---|---|---|
| Number of candidates submitted for the province council | 0 | 0 | - | 0 | - |
| Number of candidates submitted for county councils | 20 | 5 | 25.00% | 15 | 75.00% |
| Number of candidates submitted for councils of cities holding county rights | 0 | 0 | - | 0 | - |
| Number of candidates submitted for districts councils of the cap. city of Warsaw | 0 | 0 | - | 0 | - |
| Number of candidates registered for communal councils | 27 | 7 | 25.93% | 20 | 74.07% |
| Number of candidates submitted for reeve, mayor and presidential elections | 2 | 0 | 0.00% | 2 | 100.00% |
| Totalling | 49 | 12 | 24.49% | 37 | 75.51% |
Average age of submitted candidates
| Name | Average age | Average age of women | Average age of men |
|---|---|---|---|
| Average age of candidates submitted for the province council | - | - | - |
| Average age of candidates submitted for county councils | 46 | 41 | 47 |
| Average age of candidates for councils of cities holding county rights | - | - | - |
| Average age of candidates for districts councils of the cap. city of Warsaw | - | - | - |
| Average age of candidates submitted for communal councils | 39 | 39 | 40 |
| Average age of candidates for reeve, mayor, president | 51 | - | 51 |
| Totalling | 42 | 40 | 43 |
Submitted candidates grouped by age
| Name | Number of candidates | Women | Women (%) | Men | Men (%) |
|---|---|---|---|---|---|
| 18-29 | 8 | 1 | 12.50% | 7 | 87.50% |
| 30-39 | 13 | 5 | 38.46% | 8 | 61.54% |
| 40-49 | 10 | 4 | 40.00% | 6 | 60.00% |
| 50-59 | 14 | 2 | 14.29% | 12 | 85.71% |
| 60-69 | 4 | 0 | 0.00% | 4 | 100.00% |
| 70+ | 0 | 0 | — | 0 | — |
The youngest and oldest candidate submitted
| Age | Institution | |
|---|---|---|
| Youngest | 20 | Rada Gminy w Ceranowie |
| Oldest | 65 | Rada Powiatu Sokołowskiego |