Komitet Wyborczy Wyborców Przymierze w Mogilnie
| Name: | Komitet Wyborczy Wyborców Przymierze w Mogilnie | |
| Short name: | KWW Przymierze w Mogilnie | |
| Type of committee: | Election committees established by electors | |
| Address: | Świerkówiec 49, 88-300, Mogilno | |
| Plenipotentiary: | electoral | financial |
| Dariusz Łucjan Stalinski | Piotr Wojciech Smółka | |
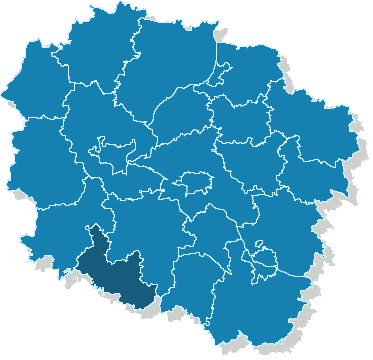
The provinces where the committee has submitted lists of candidates
| Name |
|---|
| pow. mogileński |
The statistics of election committe
Lists submitted
| Description | Number of |
|---|---|
| Number of lists submitted for province council | 0 |
| Number of lists submitted for county councils | 3 |
| Number of lists submitted for councils of cities holding county rights | 0 |
| Number of lists submitted for districts councils of the cap. city of Warsaw | 0 |
| Number of lists registered for communal councils | 4 |
| Totalling | 7 |
Submitted candidates
| Name | Number of candidates | Women | Women (%) | Men | Men (%) |
|---|---|---|---|---|---|
| Number of candidates submitted for the province council | 0 | 0 | - | 0 | - |
| Number of candidates submitted for county councils | 26 | 3 | 11.54% | 23 | 88.46% |
| Number of candidates submitted for councils of cities holding county rights | 0 | 0 | - | 0 | - |
| Number of candidates submitted for districts councils of the cap. city of Warsaw | 0 | 0 | - | 0 | - |
| Number of candidates registered for communal councils | 41 | 7 | 17.07% | 34 | 82.93% |
| Number of candidates submitted for reeve, mayor and presidential elections | 1 | 0 | 0.00% | 1 | 100.00% |
| Totalling | 68 | 10 | 14.71% | 58 | 85.29% |
Average age of submitted candidates
| Name | Average age | Average age of women | Average age of men |
|---|---|---|---|
| Average age of candidates submitted for the province council | - | - | - |
| Average age of candidates submitted for county councils | 44 | 42 | 45 |
| Average age of candidates for councils of cities holding county rights | - | - | - |
| Average age of candidates for districts councils of the cap. city of Warsaw | - | - | - |
| Average age of candidates submitted for communal councils | 47 | 54 | 45 |
| Average age of candidates for reeve, mayor, president | 42 | - | 42 |
| Totalling | 46 | 50 | 45 |
Submitted candidates grouped by age
| Name | Number of candidates | Women | Women (%) | Men | Men (%) |
|---|---|---|---|---|---|
| 18-29 | 4 | 1 | 25.00% | 3 | 75.00% |
| 30-39 | 8 | 1 | 12.50% | 7 | 87.50% |
| 40-49 | 32 | 2 | 6.25% | 30 | 93.75% |
| 50-59 | 18 | 2 | 11.11% | 16 | 88.89% |
| 60-69 | 6 | 4 | 66.67% | 2 | 33.33% |
| 70+ | 0 | 0 | — | 0 | — |
The youngest and oldest candidate submitted
| Age | Institution | |
|---|---|---|
| Youngest | 20 | Rada Powiatu Mogileńskiego |
| Oldest | 65 | Rada Miejska w Mogilnie |