Komitet Wyborczy Polskiego Stronnictwa Ludowego
| Name: | Komitet Wyborczy Polskiego Stronnictwa Ludowego | |
| Short name: | Komitet Wyborczy PSL | |
| Type of committee: | Election committees established by political parties | |
| Address: | ul. Kopernika 36/40, 00-924 Warszawa | |
| Plenipotentiary: | electoral | financial |
| Józef Szczepańczyk | Henryk Cichecki | |
The counties and cities holding county rights where the committee has submitted lists of candidates
| Name |
|---|
| gm. Golina |
| gm. Grodziec |
| gm. Kazimierz Biskupi |
| gm. Kleczew |
| gm. Kramsk |
| gm. Rychwał |
| gm. Rzgów |
| gm. Skulsk |
| gm. Sompolno |
| gm. Ślesin |
| gm. Wierzbinek |
| gm. Wilczyn |
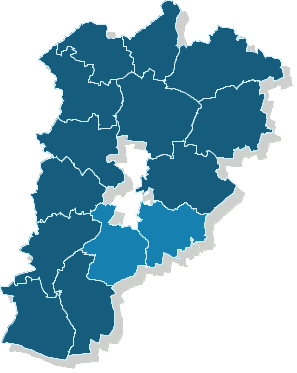
Rada Powiatu Konińskiego
Submitted candidates
| Name | Number of candidates | Women | Women (%) | Men | Men (%) | Status |
|---|---|---|---|---|---|---|
| Sum: | 50 | 15 | 30.00% | 35 | 70.00% | |
| Constituency no. 1 | 6 | 1 | 16.67% | 5 | 83.33% |
|
| Constituency no. 2 | 8 | 4 | 50.00% | 4 | 50.00% |
|
| Constituency no. 3 | 10 | 6 | 60.00% | 4 | 40.00% |
|
| Constituency no. 4 | 8 | 0 | 0.00% | 8 | 100.00% |
|
| Constituency no. 5 | 12 | 3 | 25.00% | 9 | 75.00% |
|
| Constituency no. 6 | 6 | 1 | 16.67% | 5 | 83.33% |
|
Age of the candidates
| Name | Average age | Average age of women | Average age of men | Oldest | Youngest |
|---|---|---|---|---|---|
| Constituency no. 1 | 48 | 51 | 47 | 64 | 24 |
| Constituency no. 2 | 52 | 49 | 56 | 70 | 34 |
| Constituency no. 3 | 46 | 46 | 46 | 77 | 26 |
| Constituency no. 4 | 42 | 42 | 67 | 27 | |
| Constituency no. 5 | 47 | 41 | 49 | 58 | 28 |
| Constituency no. 6 | 47 | 43 | 48 | 55 | 43 |
The statistics of election committe
Lists submitted
| Description | Number of |
|---|---|
| Number of lists submitted for county councils | 6 |
| Number of lists submitted for councils of cities holding county rights | 0 |
| Number of lists registered for communal councils | 49 |
| Totalling | 55 |
Submitted candidates
| Name | Number of candidates | Women | Women (%) | Men | Men (%) |
|---|---|---|---|---|---|
| Number of candidates submitted for county councils | 50 | 15 | 30.00% | 35 | 70.00% |
| Number of candidates submitted for councils of cities holding county rights | 0 | 0 | - | 0 | - |
| Number of candidates registered for communal councils | 59 | 14 | 23.73% | 45 | 76.27% |
| Number of candidates submitted for reeve, mayor and presidential elections | 1 | 0 | 0.00% | 1 | 100.00% |
| Totalling | 110 | 29 | 26.36% | 81 | 73.64% |
Average age of submitted candidates
| Name | Average age | Average age of women | Average age of men |
|---|---|---|---|
| Average age of candidates submitted for county councils | 47 | 46 | 48 |
| Average age of candidates for councils of cities holding county rights | - | - | - |
| Average age of candidates submitted for communal councils | 48 | 43 | 50 |
| Average age of candidates for reeve, mayor, president | 54 | - | 54 |
| Totalling | 48 | 44 | 49 |
Submitted candidates grouped by age
| Name | Number of candidates | Women | Women (%) | Men | Men (%) |
|---|---|---|---|---|---|
| 18-29 | 6 | 2 | 33.33% | 4 | 66.67% |
| 30-39 | 14 | 6 | 42.86% | 8 | 57.14% |
| 40-49 | 34 | 11 | 32.35% | 23 | 67.65% |
| 50-59 | 45 | 8 | 17.78% | 37 | 82.22% |
| 60-69 | 9 | 1 | 11.11% | 8 | 88.89% |
| 70+ | 2 | 1 | 50.00% | 1 | 50.00% |
The youngest and oldest candidate submitted
| Age | Institution | |
|---|---|---|
| Youngest | 24 | Rada Powiatu Konińskiego |
| Oldest | 77 | Rada Powiatu Konińskiego |