Komitet Wyborczy Stowarzyszenia Mała Ojczyzna w Jarosławiu
| Name: | Komitet Wyborczy Stowarzyszenia Mała Ojczyzna w Jarosławiu | |
| Short name: | KW Stowarzyszenie Mała Ojczyzna | |
| Type of committee: | Election committees established by organisations | |
| Address: | ul. Kraszewskiego 37/3, 37-500 Jarosław | |
| Plenipotentiary: | electoral | financial |
| Mirosław Sosna | Anna Kłoda | |
The provinces where the committee has submitted lists of candidates
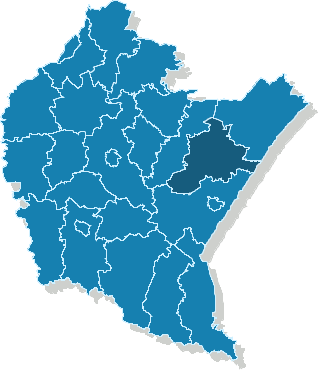
| Name |
|---|
| pow. jarosławski |
The statistics of election committe
Lists submitted
| Description | Number of |
|---|---|
| Number of lists submitted for province council | 0 |
| Number of lists submitted for county councils | 4 |
| Number of lists submitted for councils of cities holding county rights | 0 |
| Number of lists submitted for districts councils of the cap. city of Warsaw | 0 |
| Number of lists registered for communal councils | 30 |
| Totalling | 34 |
Submitted candidates
| Name | Number of candidates | Women | Women (%) | Men | Men (%) |
|---|---|---|---|---|---|
| Number of candidates submitted for the province council | 0 | 0 | - | 0 | - |
| Number of candidates submitted for county councils | 47 | 20 | 42.55% | 27 | 57.45% |
| Number of candidates submitted for councils of cities holding county rights | 0 | 0 | - | 0 | - |
| Number of candidates submitted for districts councils of the cap. city of Warsaw | 0 | 0 | - | 0 | - |
| Number of candidates registered for communal councils | 83 | 22 | 26.51% | 61 | 73.49% |
| Number of candidates submitted for reeve, mayor and presidential elections | 3 | 0 | 0.00% | 3 | 100.00% |
| Totalling | 133 | 42 | 31.58% | 91 | 68.42% |
Average age of submitted candidates
| Name | Average age | Average age of women | Average age of men |
|---|---|---|---|
| Average age of candidates submitted for the province council | - | - | - |
| Average age of candidates submitted for county councils | 42 | 41 | 43 |
| Average age of candidates for councils of cities holding county rights | - | - | - |
| Average age of candidates for districts councils of the cap. city of Warsaw | - | - | - |
| Average age of candidates submitted for communal councils | 45 | 40 | 47 |
| Average age of candidates for reeve, mayor, president | 50 | - | 50 |
| Totalling | 44 | 41 | 46 |
Submitted candidates grouped by age
| Name | Number of candidates | Women | Women (%) | Men | Men (%) |
|---|---|---|---|---|---|
| 18-29 | 22 | 9 | 40.91% | 13 | 59.09% |
| 30-39 | 24 | 9 | 37.50% | 15 | 62.50% |
| 40-49 | 39 | 13 | 33.33% | 26 | 66.67% |
| 50-59 | 34 | 10 | 29.41% | 24 | 70.59% |
| 60-69 | 12 | 1 | 8.33% | 11 | 91.67% |
| 70+ | 2 | 0 | 0.00% | 2 | 100.00% |
The youngest and oldest candidate submitted
| Age | Institution | |
|---|---|---|
| Youngest | 18 | Rada Miasta Jarosławia |
| Oldest | 79 | Rada Miasta Jarosławia |