Komitet Wyborczy Wyborców Wspólnota Samorządowa Ziemi Kozienickiej
| Name: | Komitet Wyborczy Wyborców Wspólnota Samorządowa Ziemi Kozienickiej | |
| Short name: | KWW WSZK | |
| Type of committee: | Election committees established by electors | |
| Address: | ul.Kopernika 2/22, 26-900 Kozienice | |
| Plenipotentiary: | electoral | financial |
| Kazimierz Kowalski | Jerzy Nowak | |
The provinces where the committee has submitted lists of candidates
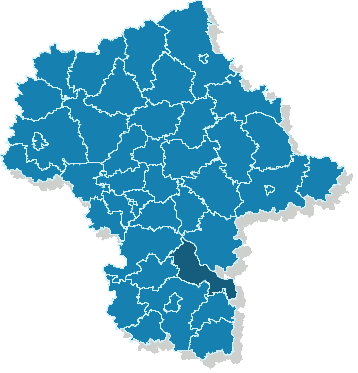
| Name |
|---|
| pow. kozienicki |
The statistics of election committe
Lists submitted
| Description | Number of |
|---|---|
| Number of lists submitted for province council | 0 |
| Number of lists submitted for county councils | 3 |
| Number of lists submitted for councils of cities holding county rights | 0 |
| Number of lists submitted for districts councils of the cap. city of Warsaw | 0 |
| Number of lists registered for communal councils | 3 |
| Totalling | 6 |
Submitted candidates
| Name | Number of candidates | Women | Women (%) | Men | Men (%) |
|---|---|---|---|---|---|
| Number of candidates submitted for the province council | 0 | 0 | - | 0 | - |
| Number of candidates submitted for county councils | 24 | 7 | 29.17% | 17 | 70.83% |
| Number of candidates submitted for councils of cities holding county rights | 0 | 0 | - | 0 | - |
| Number of candidates submitted for districts councils of the cap. city of Warsaw | 0 | 0 | - | 0 | - |
| Number of candidates registered for communal councils | 25 | 5 | 20.00% | 20 | 80.00% |
| Number of candidates submitted for reeve, mayor and presidential elections | 1 | 0 | 0.00% | 1 | 100.00% |
| Totalling | 50 | 12 | 24.00% | 38 | 76.00% |
Average age of submitted candidates
| Name | Average age | Average age of women | Average age of men |
|---|---|---|---|
| Average age of candidates submitted for the province council | - | - | - |
| Average age of candidates submitted for county councils | 48 | 43 | 51 |
| Average age of candidates for councils of cities holding county rights | - | - | - |
| Average age of candidates for districts councils of the cap. city of Warsaw | - | - | - |
| Average age of candidates submitted for communal councils | 47 | 44 | 47 |
| Average age of candidates for reeve, mayor, president | 54 | - | 54 |
| Totalling | 48 | 44 | 49 |
Submitted candidates grouped by age
| Name | Number of candidates | Women | Women (%) | Men | Men (%) |
|---|---|---|---|---|---|
| 18-29 | 4 | 2 | 50.00% | 2 | 50.00% |
| 30-39 | 9 | 1 | 11.11% | 8 | 88.89% |
| 40-49 | 8 | 4 | 50.00% | 4 | 50.00% |
| 50-59 | 23 | 5 | 21.74% | 18 | 78.26% |
| 60-69 | 5 | 0 | 0.00% | 5 | 100.00% |
| 70+ | 1 | 0 | 0.00% | 1 | 100.00% |
The youngest and oldest candidate submitted
| Age | Institution | |
|---|---|---|
| Youngest | 21 | Rada Powiatu Kozienickiego |
| Oldest | 75 | Rada Powiatu Kozienickiego |