Komitet Wyborczy Wyborców RUCH OBYWATELSKI PODHALE SPISZ ORAWA
| Name: | Komitet Wyborczy Wyborców RUCH OBYWATELSKI PODHALE SPISZ ORAWA | |
| Short name: | KWW RUCH OBYWATELSKI PODHALE SPISZ ORAWA | |
| Type of committee: | Election committees established by electors | |
| Address: | ul. Rynek 9, 34-400 Nowy Targ | |
| Plenipotentiary: | electoral | financial |
| Wiesław Tadeusz Gąsior | Jadwiga Janina Batkiewicz | |
The provinces where the committee has submitted lists of candidates
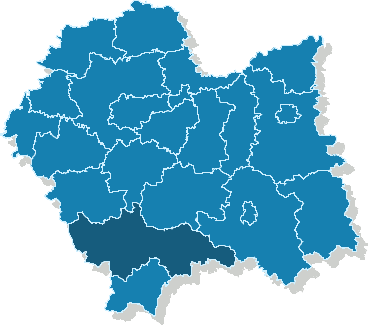
| Name |
|---|
| pow. nowotarski |
The statistics of election committe
Lists submitted
| Description | Number of |
|---|---|
| Number of lists submitted for province council | 0 |
| Number of lists submitted for county councils | 7 |
| Number of lists submitted for councils of cities holding county rights | 0 |
| Number of lists submitted for districts councils of the cap. city of Warsaw | 0 |
| Number of lists registered for communal councils | 2 |
| Totalling | 9 |
Submitted candidates
| Name | Number of candidates | Women | Women (%) | Men | Men (%) |
|---|---|---|---|---|---|
| Number of candidates submitted for the province council | 0 | 0 | - | 0 | - |
| Number of candidates submitted for county councils | 56 | 9 | 16.07% | 47 | 83.93% |
| Number of candidates submitted for councils of cities holding county rights | 0 | 0 | - | 0 | - |
| Number of candidates submitted for districts councils of the cap. city of Warsaw | 0 | 0 | - | 0 | - |
| Number of candidates registered for communal councils | 4 | 1 | 25.00% | 3 | 75.00% |
| Number of candidates submitted for reeve, mayor and presidential elections | 0 | 0 | - | 0 | - |
| Totalling | 60 | 10 | 16.67% | 50 | 83.33% |
Average age of submitted candidates
| Name | Average age | Average age of women | Average age of men |
|---|---|---|---|
| Average age of candidates submitted for the province council | - | - | - |
| Average age of candidates submitted for county councils | 47 | 52 | 46 |
| Average age of candidates for councils of cities holding county rights | - | - | - |
| Average age of candidates for districts councils of the cap. city of Warsaw | - | - | - |
| Average age of candidates submitted for communal councils | 40 | 30 | 43 |
| Average age of candidates for reeve, mayor, president | - | - | - |
| Totalling | 46 | 50 | 45 |
Submitted candidates grouped by age
| Name | Number of candidates | Women | Women (%) | Men | Men (%) |
|---|---|---|---|---|---|
| 18-29 | 4 | 0 | 0.00% | 4 | 100.00% |
| 30-39 | 10 | 2 | 20.00% | 8 | 80.00% |
| 40-49 | 22 | 3 | 13.64% | 19 | 86.36% |
| 50-59 | 19 | 4 | 21.05% | 15 | 78.95% |
| 60-69 | 2 | 0 | 0.00% | 2 | 100.00% |
| 70+ | 3 | 1 | 33.33% | 2 | 66.67% |
The youngest and oldest candidate submitted
| Age | Institution | |
|---|---|---|
| Youngest | 24 | Rada Powiatu Nowotarskiego |
| Oldest | 73 | Rada Powiatu Nowotarskiego |