Komitet Wyborczy Liga Polskich Rodzin
| Name: | Komitet Wyborczy Liga Polskich Rodzin | |
| Short name: | KW Liga Polskich Rodzin | |
| Type of committee: | Election committees established by political parties | |
| Address: | ul. Hoża 9, 00-528 Warszawa | |
| Plenipotentiary: | electoral | financial |
| Paweł Adam Sulowski | Marta Barbara Zanin | |
The provinces where the committee has submitted lists of candidates
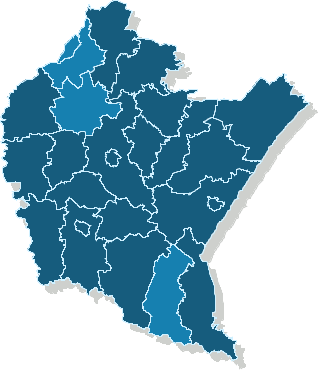
Sejmik Województwa Podkarpackiego
Submitted candidates
| Name | Number of candidates | Women | Women (%) | Men | Men (%) | Status |
|---|---|---|---|---|---|---|
| Sum: | 63 | 17 | 26.98% | 46 | 73.02% | |
| Constituency no. 1 | 12 | 4 | 33.33% | 8 | 66.67% |
|
| Constituency no. 2 | 11 | 2 | 18.18% | 9 | 81.82% |
|
| Constituency no. 3 | 12 | 2 | 16.67% | 10 | 83.33% |
|
| Constituency no. 4 | 12 | 4 | 33.33% | 8 | 66.67% |
|
| Constituency no. 5 | 16 | 5 | 31.25% | 11 | 68.75% |
|
Age of the candidates
| Name | Average age | Average age of women | Average age of men | Oldest | Youngest |
|---|---|---|---|---|---|
| Constituency no. 1 | 45 | 48 | 43 | 63 | 25 |
| Constituency no. 2 | 44 | 43 | 44 | 69 | 20 |
| Constituency no. 3 | 35 | 53 | 31 | 55 | 23 |
| Constituency no. 4 | 45 | 43 | 47 | 65 | 21 |
| Constituency no. 5 | 37 | 35 | 37 | 65 | 18 |
The statistics of election committe
Lists submitted
| Description | Number of |
|---|---|
| Number of lists submitted for province council | 5 |
| Number of lists submitted for county councils | 63 |
| Number of lists submitted for councils of cities holding county rights | 11 |
| Number of lists registered for communal councils | 217 |
| Totalling | 296 |
Submitted candidates
| Name | Number of candidates | Women | Women (%) | Men | Men (%) |
|---|---|---|---|---|---|
| Number of candidates submitted for the province council | 63 | 17 | 26.98% | 46 | 73.02% |
| Number of candidates submitted for county councils | 380 | 123 | 32.37% | 257 | 67.63% |
| Number of candidates submitted for councils of cities holding county rights | 88 | 27 | 30.68% | 61 | 69.32% |
| Number of candidates registered for communal councils | 518 | 158 | 30.50% | 360 | 69.50% |
| Number of candidates submitted for reeve, mayor and presidential elections | 18 | 2 | 11.11% | 16 | 88.89% |
| Totalling | 1,067 | 327 | 30.65% | 740 | 69.35% |
Average age of submitted candidates
| Name | Average age | Average age of women | Average age of men |
|---|---|---|---|
| Average age of candidates submitted for the province council | 41 | 43 | 40 |
| Average age of candidates submitted for county councils | 44 | 43 | 45 |
| Average age of candidates for councils of cities holding county rights | 48 | 49 | 47 |
| Average age of candidates submitted for communal councils | 44 | 43 | 44 |
| Average age of candidates for reeve, mayor, president | 51 | 51 | 51 |
| Totalling | 44 | 44 | 44 |
Submitted candidates grouped by age
| Name | Number of candidates | Women | Women (%) | Men | Men (%) |
|---|---|---|---|---|---|
| 18-29 | 180 | 52 | 28.89% | 128 | 71.11% |
| 30-39 | 169 | 55 | 32.54% | 114 | 67.46% |
| 40-49 | 298 | 100 | 33.56% | 198 | 66.44% |
| 50-59 | 300 | 95 | 31.67% | 205 | 68.33% |
| 60-69 | 97 | 22 | 22.68% | 75 | 77.32% |
| 70+ | 23 | 3 | 13.04% | 20 | 86.96% |
The youngest and oldest candidate submitted
| Age | Institution | |
|---|---|---|
| Youngest | 18 | Rada Powiatu Mieleckiego |
| Oldest | 81 | Rada Miejska w Stalowej Woli |