Komitet Wyborczy Wyborców WSPÓLNOTA SAMORZĄDOWA ZIEMI PUŁAWSKIEJ
| Name: | Komitet Wyborczy Wyborców WSPÓLNOTA SAMORZĄDOWA ZIEMI PUŁAWSKIEJ | |
| Short name: | KWW WSPÓLNOTA SAMORZĄDOWA ZP | |
| Type of committee: | Election committees established by electors | |
| Address: | UL. CENTRALNA 2A, 24-100 PUŁAWY | |
| Plenipotentiary: | electoral | financial |
| Grzegorz Dariusz Nakonieczny | Aleksandra Maria Sikora | |
The provinces where the committee has submitted lists of candidates
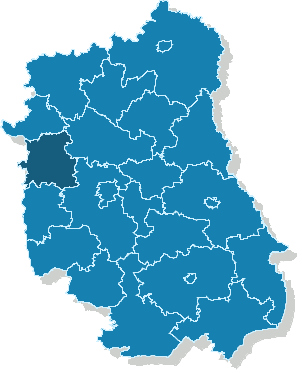
| Name |
|---|
| pow. puławski |
The statistics of election committe
Lists submitted
| Description | Number of |
|---|---|
| Number of lists submitted for province council | 0 |
| Number of lists submitted for county councils | 5 |
| Number of lists submitted for councils of cities holding county rights | 0 |
| Number of lists submitted for districts councils of the cap. city of Warsaw | 0 |
| Number of lists registered for communal councils | 8 |
| Totalling | 13 |
Submitted candidates
| Name | Number of candidates | Women | Women (%) | Men | Men (%) |
|---|---|---|---|---|---|
| Number of candidates submitted for the province council | 0 | 0 | - | 0 | - |
| Number of candidates submitted for county councils | 46 | 13 | 28.26% | 33 | 71.74% |
| Number of candidates submitted for councils of cities holding county rights | 0 | 0 | - | 0 | - |
| Number of candidates submitted for districts councils of the cap. city of Warsaw | 0 | 0 | - | 0 | - |
| Number of candidates registered for communal councils | 54 | 12 | 22.22% | 42 | 77.78% |
| Number of candidates submitted for reeve, mayor and presidential elections | 1 | 0 | 0.00% | 1 | 100.00% |
| Totalling | 101 | 25 | 24.75% | 76 | 75.25% |
Average age of submitted candidates
| Name | Average age | Average age of women | Average age of men |
|---|---|---|---|
| Average age of candidates submitted for the province council | - | - | - |
| Average age of candidates submitted for county councils | 45 | 45 | 45 |
| Average age of candidates for councils of cities holding county rights | - | - | - |
| Average age of candidates for districts councils of the cap. city of Warsaw | - | - | - |
| Average age of candidates submitted for communal councils | 42 | 47 | 41 |
| Average age of candidates for reeve, mayor, president | 42 | - | 42 |
| Totalling | 43 | 46 | 42 |
Submitted candidates grouped by age
| Name | Number of candidates | Women | Women (%) | Men | Men (%) |
|---|---|---|---|---|---|
| 18-29 | 8 | 1 | 12.50% | 7 | 87.50% |
| 30-39 | 26 | 5 | 19.23% | 21 | 80.77% |
| 40-49 | 36 | 7 | 19.44% | 29 | 80.56% |
| 50-59 | 25 | 10 | 40.00% | 15 | 60.00% |
| 60-69 | 6 | 2 | 33.33% | 4 | 66.67% |
| 70+ | 0 | 0 | — | 0 | — |
The youngest and oldest candidate submitted
| Age | Institution | |
|---|---|---|
| Youngest | 23 | Rada Miasta Puławy |
| Oldest | 67 | Rada Miasta Puławy |