Komitet Wyborczy Wyborców "Bezpartyjne Centrum"
| Name: | Komitet Wyborczy Wyborców "Bezpartyjne Centrum" | |
| Short name: | KWW "Bezpartyjne Centrum" | |
| Type of committee: | Election committees established by electors | |
| Address: | ul. Filipa de Girarda 14 m 43, 96-300 Żyrardów | |
| Plenipotentiary: | electoral | financial |
| Jan Józef Lepieszka | Robert Piotr Konarski | |
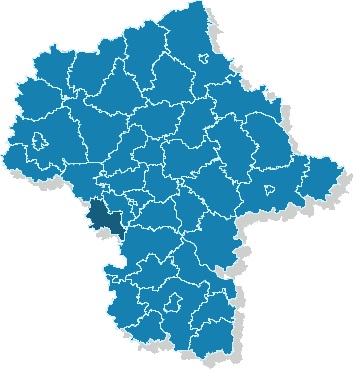
The provinces where the committee has submitted lists of candidates
| Name |
|---|
| pow. żyrardowski |
The statistics of election committe
Lists submitted
| Description | Number of |
|---|---|
| Number of lists submitted for province council | 0 |
| Number of lists submitted for county councils | 2 |
| Number of lists submitted for councils of cities holding county rights | 0 |
| Number of lists submitted for districts councils of the cap. city of Warsaw | 0 |
| Number of lists registered for communal councils | 3 |
| Totalling | 5 |
Submitted candidates
| Name | Number of candidates | Women | Women (%) | Men | Men (%) |
|---|---|---|---|---|---|
| Number of candidates submitted for the province council | 0 | 0 | - | 0 | - |
| Number of candidates submitted for county councils | 19 | 10 | 52.63% | 9 | 47.37% |
| Number of candidates submitted for councils of cities holding county rights | 0 | 0 | - | 0 | - |
| Number of candidates submitted for districts councils of the cap. city of Warsaw | 0 | 0 | - | 0 | - |
| Number of candidates registered for communal councils | 33 | 14 | 42.42% | 19 | 57.58% |
| Number of candidates submitted for reeve, mayor and presidential elections | 0 | 0 | - | 0 | - |
| Totalling | 52 | 24 | 46.15% | 28 | 53.85% |
Average age of submitted candidates
| Name | Average age | Average age of women | Average age of men |
|---|---|---|---|
| Average age of candidates submitted for the province council | - | - | - |
| Average age of candidates submitted for county councils | 54 | 50 | 58 |
| Average age of candidates for councils of cities holding county rights | - | - | - |
| Average age of candidates for districts councils of the cap. city of Warsaw | - | - | - |
| Average age of candidates submitted for communal councils | 46 | 44 | 48 |
| Average age of candidates for reeve, mayor, president | - | - | - |
| Totalling | 49 | 46 | 51 |
Submitted candidates grouped by age
| Name | Number of candidates | Women | Women (%) | Men | Men (%) |
|---|---|---|---|---|---|
| 18-29 | 4 | 2 | 50.00% | 2 | 50.00% |
| 30-39 | 7 | 2 | 28.57% | 5 | 71.43% |
| 40-49 | 15 | 11 | 73.33% | 4 | 26.67% |
| 50-59 | 16 | 6 | 37.50% | 10 | 62.50% |
| 60-69 | 6 | 1 | 16.67% | 5 | 83.33% |
| 70+ | 4 | 2 | 50.00% | 2 | 50.00% |
The youngest and oldest candidate submitted
| Age | Institution | |
|---|---|---|
| Youngest | 22 | Rada Miejska Żyrardowa |
| Oldest | 76 | Rada Powiatu Żyrardowskiego |