Komitet Wyborczy Wyborców TWÓJ DOBRY WYBÓR
| Name: | Komitet Wyborczy Wyborców TWÓJ DOBRY WYBÓR | |
| Short name: | KWW TWÓJ DOBRY WYBÓR | |
| Type of committee: | Election committees established by electors | |
| Address: | ul. Kolejowa 2, 32-090 Słomniki | |
| Plenipotentiary: | electoral | financial |
| Hubert Telejko | Tomasz Tybulczuk | |
The provinces where the committee has submitted lists of candidates
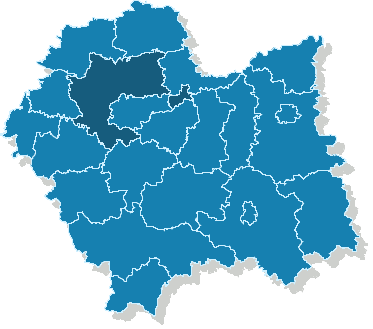
| Name |
|---|
| pow. krakowski |
Sejmik Województwa Małopolskiego
Submitted candidates
| Name | Number of candidates | Women | Women (%) | Men | Men (%) | Status |
|---|---|---|---|---|---|---|
| Sum: | 5 | 0 | 0.00% | 5 | 100.00% | |
| Constituency no. 3 | 5 | 0 | 0.00% | 5 | 100.00% |
|
Age of the candidates
| Name | Average age | Average age of women | Average age of men | Oldest | Youngest |
|---|---|---|---|---|---|
| Constituency no. 3 | 25 | 25 | 27 | 23 |
The statistics of election committe
Lists submitted
| Description | Number of |
|---|---|
| Number of lists submitted for province council | 1 |
| Number of lists submitted for county councils | 1 |
| Number of lists submitted for councils of cities holding county rights | 0 |
| Number of lists submitted for districts councils of the cap. city of Warsaw | 0 |
| Number of lists registered for communal councils | 0 |
| Totalling | 2 |
Submitted candidates
| Name | Number of candidates | Women | Women (%) | Men | Men (%) |
|---|---|---|---|---|---|
| Number of candidates submitted for the province council | 5 | 0 | 0.00% | 5 | 100.00% |
| Number of candidates submitted for county councils | 3 | 0 | 0.00% | 3 | 100.00% |
| Number of candidates submitted for councils of cities holding county rights | 0 | 0 | - | 0 | - |
| Number of candidates submitted for districts councils of the cap. city of Warsaw | 0 | 0 | - | 0 | - |
| Number of candidates registered for communal councils | 0 | 0 | - | 0 | - |
| Number of candidates submitted for reeve, mayor and presidential elections | 0 | 0 | - | 0 | - |
| Totalling | 8 | 0 | 0.00% | 8 | 100.00% |
Average age of submitted candidates
| Name | Average age | Average age of women | Average age of men |
|---|---|---|---|
| Average age of candidates submitted for the province council | 25 | - | 25 |
| Average age of candidates submitted for county councils | 27 | - | 27 |
| Average age of candidates for councils of cities holding county rights | - | - | - |
| Average age of candidates for districts councils of the cap. city of Warsaw | - | - | - |
| Average age of candidates submitted for communal councils | - | - | - |
| Average age of candidates for reeve, mayor, president | - | - | - |
| Totalling | 26 | - | 26 |
Submitted candidates grouped by age
| Name | Number of candidates | Women | Women (%) | Men | Men (%) |
|---|---|---|---|---|---|
| 18-29 | 8 | 0 | 0.00% | 8 | 100.00% |
| 30-39 | 0 | 0 | — | 0 | — |
| 40-49 | 0 | 0 | — | 0 | — |
| 50-59 | 0 | 0 | — | 0 | — |
| 60-69 | 0 | 0 | — | 0 | — |
| 70+ | 0 | 0 | — | 0 | — |
The youngest and oldest candidate submitted
| Age | Institution | |
|---|---|---|
| Youngest | 23 | Sejmik Województwa Małopolskiego |
| Oldest | 27 | Rada Powiatu Krakowskiego |