Komitet Wyborczy Stowarzyszenie "Sprawni Inaczej" w Kłodawie
| Name: | Komitet Wyborczy Stowarzyszenie "Sprawni Inaczej" w Kłodawie | |
| Short name: | KW "Sprawni Inaczej" w Kłodawie | |
| Type of committee: | Election committees established by organisations | |
| Address: | Dąbska 14, 62-650 Kłodawa | |
| Plenipotentiary: | electoral | financial |
| Elżbieta Iwonna Bilska | Anna Dorota Makosińska | |
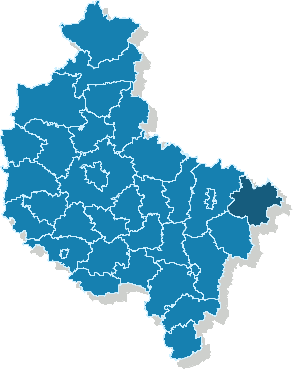
The provinces where the committee has submitted lists of candidates
| Name |
|---|
| pow. kolski |
The statistics of election committe
Lists submitted
| Description | Number of |
|---|---|
| Number of lists submitted for province council | 0 |
| Number of lists submitted for county councils | 0 |
| Number of lists submitted for councils of cities holding county rights | 0 |
| Number of lists submitted for districts councils of the cap. city of Warsaw | 0 |
| Number of lists registered for communal councils | 3 |
| Totalling | 3 |
Submitted candidates
| Name | Number of candidates | Women | Women (%) | Men | Men (%) |
|---|---|---|---|---|---|
| Number of candidates submitted for the province council | 0 | 0 | - | 0 | - |
| Number of candidates submitted for county councils | 0 | 0 | - | 0 | - |
| Number of candidates submitted for councils of cities holding county rights | 0 | 0 | - | 0 | - |
| Number of candidates submitted for districts councils of the cap. city of Warsaw | 0 | 0 | - | 0 | - |
| Number of candidates registered for communal councils | 5 | 2 | 40.00% | 3 | 60.00% |
| Number of candidates submitted for reeve, mayor and presidential elections | 0 | 0 | - | 0 | - |
| Totalling | 5 | 2 | 40.00% | 3 | 60.00% |
Average age of submitted candidates
| Name | Average age | Average age of women | Average age of men |
|---|---|---|---|
| Average age of candidates submitted for the province council | - | - | - |
| Average age of candidates submitted for county councils | - | - | - |
| Average age of candidates for councils of cities holding county rights | - | - | - |
| Average age of candidates for districts councils of the cap. city of Warsaw | - | - | - |
| Average age of candidates submitted for communal councils | 53 | 44 | 59 |
| Average age of candidates for reeve, mayor, president | - | - | - |
| Totalling | 53 | 44 | 59 |
Submitted candidates grouped by age
| Name | Number of candidates | Women | Women (%) | Men | Men (%) |
|---|---|---|---|---|---|
| 18-29 | 0 | 0 | — | 0 | — |
| 30-39 | 1 | 1 | 100.00% | 0 | 0.00% |
| 40-49 | 0 | 0 | — | 0 | — |
| 50-59 | 2 | 1 | 50.00% | 1 | 50.00% |
| 60-69 | 2 | 0 | 0.00% | 2 | 100.00% |
| 70+ | 0 | 0 | — | 0 | — |
The youngest and oldest candidate submitted
| Age | Institution | |
|---|---|---|
| Youngest | 37 | Rada Miejska w Kłodawie |
| Oldest | 65 | Rada Miejska w Kłodawie |