Komitet Wyborczy POROZUMIENIE SAMORZĄDOWE
| Name: | Komitet Wyborczy POROZUMIENIE SAMORZĄDOWE | |
| Short name: | Komitet Wyborczy PS | |
| Type of committee: | Election committees established by organisations | |
| Address: | ul. Fabryczna 4, 39-120 Sędziszów Małopolski | |
| Plenipotentiary: | electoral | financial |
| Stanisław Ziemiński | Józef Wątróbski | |
The provinces where the committee has submitted lists of candidates
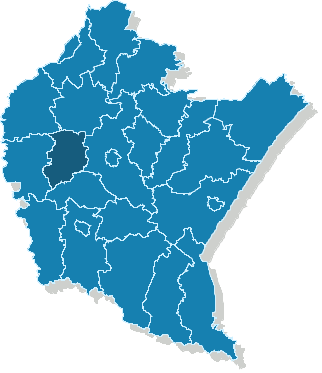
| Name |
|---|
| pow. ropczycko-sędziszowski |
The statistics of election committe
Lists submitted
| Description | Number of |
|---|---|
| Number of lists submitted for province council | 0 |
| Number of lists submitted for county councils | 3 |
| Number of lists submitted for councils of cities holding county rights | 0 |
| Number of lists submitted for districts councils of the cap. city of Warsaw | 0 |
| Number of lists registered for communal councils | 28 |
| Totalling | 31 |
Submitted candidates
| Name | Number of candidates | Women | Women (%) | Men | Men (%) |
|---|---|---|---|---|---|
| Number of candidates submitted for the province council | 0 | 0 | - | 0 | - |
| Number of candidates submitted for county councils | 38 | 3 | 7.89% | 35 | 92.11% |
| Number of candidates submitted for councils of cities holding county rights | 0 | 0 | - | 0 | - |
| Number of candidates submitted for districts councils of the cap. city of Warsaw | 0 | 0 | - | 0 | - |
| Number of candidates registered for communal councils | 120 | 27 | 22.50% | 93 | 77.50% |
| Number of candidates submitted for reeve, mayor and presidential elections | 5 | 0 | 0.00% | 5 | 100.00% |
| Totalling | 163 | 30 | 18.40% | 133 | 81.60% |
Average age of submitted candidates
| Name | Average age | Average age of women | Average age of men |
|---|---|---|---|
| Average age of candidates submitted for the province council | - | - | - |
| Average age of candidates submitted for county councils | 51 | 53 | 51 |
| Average age of candidates for councils of cities holding county rights | - | - | - |
| Average age of candidates for districts councils of the cap. city of Warsaw | - | - | - |
| Average age of candidates submitted for communal councils | 47 | 45 | 48 |
| Average age of candidates for reeve, mayor, president | 53 | - | 53 |
| Totalling | 48 | 46 | 49 |
Submitted candidates grouped by age
| Name | Number of candidates | Women | Women (%) | Men | Men (%) |
|---|---|---|---|---|---|
| 18-29 | 5 | 2 | 40.00% | 3 | 60.00% |
| 30-39 | 29 | 6 | 20.69% | 23 | 79.31% |
| 40-49 | 48 | 9 | 18.75% | 39 | 81.25% |
| 50-59 | 61 | 11 | 18.03% | 50 | 81.97% |
| 60-69 | 16 | 2 | 12.50% | 14 | 87.50% |
| 70+ | 4 | 0 | 0.00% | 4 | 100.00% |
The youngest and oldest candidate submitted
| Age | Institution | |
|---|---|---|
| Youngest | 24 | Rada Miejska w Ropczycach |
| Oldest | 74 | Rada Miejska w Ropczycach |