Komitet Wyborczy Wyborców Rozwój i Partnerstwo
| Name: | Komitet Wyborczy Wyborców Rozwój i Partnerstwo | |
| Short name: | KWW Rozwój i Partnerstwo | |
| Type of committee: | Election committees established by electors | |
| Address: | ul.Wojska Polskiego 18, 57-300 Kłodzko | |
| Plenipotentiary: | electoral | financial |
| Anna, Małgorzata Nowacka | Tomasz, Andrzej Nowacki | |
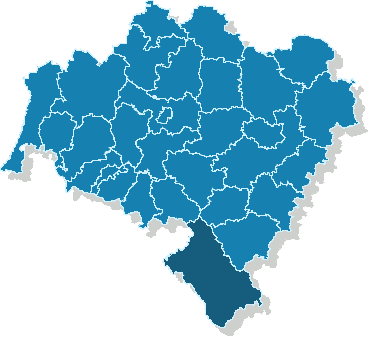
The provinces where the committee has submitted lists of candidates
| Name |
|---|
| pow. kłodzki |
The statistics of election committe
Lists submitted
| Description | Number of |
|---|---|
| Number of lists submitted for province council | 0 |
| Number of lists submitted for county councils | 7 |
| Number of lists submitted for councils of cities holding county rights | 0 |
| Number of lists submitted for districts councils of the cap. city of Warsaw | 0 |
| Number of lists registered for communal councils | 23 |
| Totalling | 30 |
Submitted candidates
| Name | Number of candidates | Women | Women (%) | Men | Men (%) |
|---|---|---|---|---|---|
| Number of candidates submitted for the province council | 0 | 0 | - | 0 | - |
| Number of candidates submitted for county councils | 55 | 18 | 32.73% | 37 | 67.27% |
| Number of candidates submitted for councils of cities holding county rights | 0 | 0 | - | 0 | - |
| Number of candidates submitted for districts councils of the cap. city of Warsaw | 0 | 0 | - | 0 | - |
| Number of candidates registered for communal councils | 76 | 20 | 26.32% | 56 | 73.68% |
| Number of candidates submitted for reeve, mayor and presidential elections | 2 | 0 | 0.00% | 2 | 100.00% |
| Totalling | 133 | 38 | 28.57% | 95 | 71.43% |
Average age of submitted candidates
| Name | Average age | Average age of women | Average age of men |
|---|---|---|---|
| Average age of candidates submitted for the province council | - | - | - |
| Average age of candidates submitted for county councils | 45 | 41 | 46 |
| Average age of candidates for councils of cities holding county rights | - | - | - |
| Average age of candidates for districts councils of the cap. city of Warsaw | - | - | - |
| Average age of candidates submitted for communal councils | 46 | 48 | 45 |
| Average age of candidates for reeve, mayor, president | 60 | - | 60 |
| Totalling | 46 | 45 | 46 |
Submitted candidates grouped by age
| Name | Number of candidates | Women | Women (%) | Men | Men (%) |
|---|---|---|---|---|---|
| 18-29 | 10 | 3 | 30.00% | 7 | 70.00% |
| 30-39 | 23 | 7 | 30.43% | 16 | 69.57% |
| 40-49 | 53 | 15 | 28.30% | 38 | 71.70% |
| 50-59 | 37 | 10 | 27.03% | 27 | 72.97% |
| 60-69 | 9 | 3 | 33.33% | 6 | 66.67% |
| 70+ | 1 | 0 | 0.00% | 1 | 100.00% |
The youngest and oldest candidate submitted
| Age | Institution | |
|---|---|---|
| Youngest | 20 | Rada Powiatu Kłodzkiego |
| Oldest | 74 | Rada Powiatu Kłodzkiego |