Komitet Wyborczy Chrześcijańskiego Ruchu Samorządowego
| Name: | Komitet Wyborczy Chrześcijańskiego Ruchu Samorządowego | |
| Short name: | KW Chrześcijańskiego Ruchu Samorządowego | |
| Type of committee: | Election committees established by organisations | |
| Address: | ul. Piotrkowska 133, 90-434 Łódź | |
| Plenipotentiary: | electoral | financial |
| Grzegorz Kaźmierczak | Grażyna Korasiewicz | |
| Name |
|---|
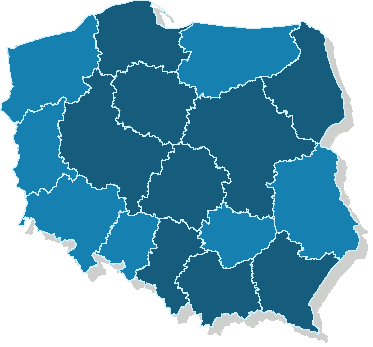
| woj. kujawsko-pomorskie |
| woj. łódzkie |
| woj. małopolskie |
| woj. mazowieckie |
| woj. podkarpackie |
| woj. podlaskie |
| woj. pomorskie |
| woj. śląskie |
| woj. wielkopolskie |
The statistics of election committe
Lists submitted
| Description | Number of |
|---|---|
| Number of lists submitted for province council | 13 |
| Number of lists submitted for county councils | 33 |
| Number of lists submitted for councils of cities holding county rights | 26 |
| Number of lists submitted for districts councils of the cap. city of Warsaw | 0 |
| Number of lists registered for communal councils | 76 |
| Totalling | 148 |
Submitted candidates
| Name | Number of candidates | Women | Women (%) | Men | Men (%) |
|---|---|---|---|---|---|
| Number of candidates submitted for the province council | 107 | 30 | 28.04% | 77 | 71.96% |
| Number of candidates submitted for county councils | 206 | 69 | 33.50% | 137 | 66.50% |
| Number of candidates submitted for councils of cities holding county rights | 206 | 66 | 32.04% | 140 | 67.96% |
| Number of candidates submitted for districts councils of the cap. city of Warsaw | 0 | 0 | - | 0 | - |
| Number of candidates registered for communal councils | 286 | 94 | 32.87% | 192 | 67.13% |
| Number of candidates submitted for reeve, mayor and presidential elections | 16 | 3 | 18.75% | 13 | 81.25% |
| Totalling | 821 | 262 | 31.91% | 559 | 68.09% |
Average age of submitted candidates
| Name | Average age | Average age of women | Average age of men |
|---|---|---|---|
| Average age of candidates submitted for the province council | 47 | 42 | 48 |
| Average age of candidates submitted for county councils | 47 | 48 | 46 |
| Average age of candidates for councils of cities holding county rights | 44 | 44 | 45 |
| Average age of candidates for districts councils of the cap. city of Warsaw | - | - | - |
| Average age of candidates submitted for communal councils | 44 | 44 | 44 |
| Average age of candidates for reeve, mayor, president | 49 | 45 | 50 |
| Totalling | 45 | 45 | 45 |
Submitted candidates grouped by age
| Name | Number of candidates | Women | Women (%) | Men | Men (%) |
|---|---|---|---|---|---|
| 18-29 | 89 | 30 | 33.71% | 59 | 66.29% |
| 30-39 | 147 | 41 | 27.89% | 106 | 72.11% |
| 40-49 | 263 | 88 | 33.46% | 175 | 66.54% |
| 50-59 | 239 | 85 | 35.56% | 154 | 64.44% |
| 60-69 | 66 | 14 | 21.21% | 52 | 78.79% |
| 70+ | 17 | 4 | 23.53% | 13 | 76.47% |
The youngest and oldest candidate submitted
| Age | Institution | |
|---|---|---|
| Youngest | 18 | Rada Miejska w Świętochłowicach |
| Oldest | 76 | Rada Gminy w Kamienicy |