Komitet Wyborczy Wyborców Ruch Samorządowy Prawicy Na Rzecz Powiatu i Gmin
| Name: | Komitet Wyborczy Wyborców Ruch Samorządowy Prawicy Na Rzecz Powiatu i Gmin | |
| Short name: | KWW Ruch Samorządowy Prawicy | |
| Type of committee: | Election committees established by electors | |
| Address: | Sucha ul. Polna 1A, 26-800 Białobrzegi | |
| Plenipotentiary: | electoral | financial |
| Andrzej Oziębło | Robert Jabłoński | |
The provinces where the committee has submitted lists of candidates
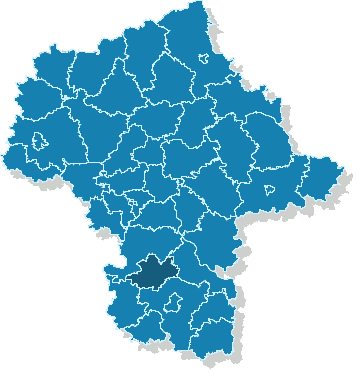
| Name |
|---|
| pow. białobrzeski |
The statistics of election committe
Lists submitted
| Description | Number of |
|---|---|
| Number of lists submitted for province council | 0 |
| Number of lists submitted for county councils | 3 |
| Number of lists submitted for councils of cities holding county rights | 0 |
| Number of lists submitted for districts councils of the cap. city of Warsaw | 0 |
| Number of lists registered for communal councils | 67 |
| Totalling | 70 |
Submitted candidates
| Name | Number of candidates | Women | Women (%) | Men | Men (%) |
|---|---|---|---|---|---|
| Number of candidates submitted for the province council | 0 | 0 | - | 0 | - |
| Number of candidates submitted for county councils | 30 | 6 | 20.00% | 24 | 80.00% |
| Number of candidates submitted for councils of cities holding county rights | 0 | 0 | - | 0 | - |
| Number of candidates submitted for districts councils of the cap. city of Warsaw | 0 | 0 | - | 0 | - |
| Number of candidates registered for communal councils | 77 | 21 | 27.27% | 56 | 72.73% |
| Number of candidates submitted for reeve, mayor and presidential elections | 6 | 0 | 0.00% | 6 | 100.00% |
| Totalling | 113 | 27 | 23.89% | 86 | 76.11% |
Average age of submitted candidates
| Name | Average age | Average age of women | Average age of men |
|---|---|---|---|
| Average age of candidates submitted for the province council | - | - | - |
| Average age of candidates submitted for county councils | 41 | 38 | 42 |
| Average age of candidates for councils of cities holding county rights | - | - | - |
| Average age of candidates for districts councils of the cap. city of Warsaw | - | - | - |
| Average age of candidates submitted for communal councils | 40 | 39 | 40 |
| Average age of candidates for reeve, mayor, president | 46 | - | 46 |
| Totalling | 41 | 39 | 41 |
Submitted candidates grouped by age
| Name | Number of candidates | Women | Women (%) | Men | Men (%) |
|---|---|---|---|---|---|
| 18-29 | 15 | 4 | 26.67% | 11 | 73.33% |
| 30-39 | 36 | 8 | 22.22% | 28 | 77.78% |
| 40-49 | 40 | 13 | 32.50% | 27 | 67.50% |
| 50-59 | 19 | 1 | 5.26% | 18 | 94.74% |
| 60-69 | 2 | 1 | 50.00% | 1 | 50.00% |
| 70+ | 1 | 0 | 0.00% | 1 | 100.00% |
The youngest and oldest candidate submitted
| Age | Institution | |
|---|---|---|
| Youngest | 20 | Rada Gminy Stromiec |
| Oldest | 70 | Rada Gminy Stromiec |