Komitet Wyborczy Polska Partia Pracy
| Name: | Komitet Wyborczy Polska Partia Pracy | |
| Short name: | Komitet Wyborczy Polska Partia Pracy | |
| Type of committee: | Election committees established by political parties | |
| Address: | Al. Wyzwolenia 18, 00-570 Warszawa | |
| Plenipotentiary: | electoral | financial |
| Michał Janiszewski | Zbigniew Stanisław Śniadecki | |
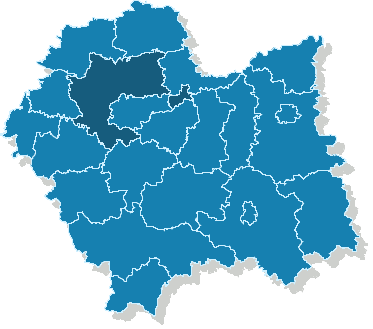
The provinces where the committee has submitted lists of candidates
| Name |
|---|
| pow. krakowski |
Sejmik Województwa Małopolskiego
Submitted candidates
| Name | Number of candidates | Women | Women (%) | Men | Men (%) | Status |
|---|---|---|---|---|---|---|
| Sum: | 57 | 11 | 19.30% | 46 | 80.70% | |
| Constituency no. 1 | 8 | 1 | 12.50% | 7 | 87.50% |
|
| Constituency no. 2 | 9 | 2 | 22.22% | 7 | 77.78% |
|
| Constituency no. 3 | 14 | 1 | 7.14% | 13 | 92.86% |
|
| Constituency no. 4 | 9 | 1 | 11.11% | 8 | 88.89% |
|
| Constituency no. 5 | 7 | 1 | 14.29% | 6 | 85.71% |
|
| Constituency no. 6 | 10 | 5 | 50.00% | 5 | 50.00% |
|
Age of the candidates
| Name | Average age | Average age of women | Average age of men | Oldest | Youngest |
|---|---|---|---|---|---|
| Constituency no. 1 | 35 | 35 | 35 | 44 | 24 |
| Constituency no. 2 | 34 | 30 | 35 | 49 | 19 |
| Constituency no. 3 | 33 | 45 | 33 | 45 | 20 |
| Constituency no. 4 | 40 | 44 | 40 | 56 | 19 |
| Constituency no. 5 | 39 | 52 | 37 | 52 | 32 |
| Constituency no. 6 | 43 | 47 | 38 | 52 | 20 |
The statistics of election committe
Lists submitted
| Description | Number of |
|---|---|
| Number of lists submitted for province council | 6 |
| Number of lists submitted for county councils | 0 |
| Number of lists submitted for councils of cities holding county rights | 0 |
| Number of lists registered for communal councils | 1 |
| Totalling | 7 |
Submitted candidates
| Name | Number of candidates | Women | Women (%) | Men | Men (%) |
|---|---|---|---|---|---|
| Number of candidates submitted for the province council | 57 | 11 | 19.30% | 46 | 80.70% |
| Number of candidates submitted for county councils | 0 | 0 | - | 0 | - |
| Number of candidates submitted for councils of cities holding county rights | 0 | 0 | - | 0 | - |
| Number of candidates registered for communal councils | 1 | 0 | 0.00% | 1 | 100.00% |
| Number of candidates submitted for reeve, mayor and presidential elections | 0 | 0 | - | 0 | - |
| Totalling | 58 | 11 | 18.97% | 47 | 81.03% |
Average age of submitted candidates
| Name | Average age | Average age of women | Average age of men |
|---|---|---|---|
| Average age of candidates submitted for the province council | 37 | 43 | 36 |
| Average age of candidates submitted for county councils | - | - | - |
| Average age of candidates for councils of cities holding county rights | - | - | - |
| Average age of candidates submitted for communal councils | 51 | - | 51 |
| Average age of candidates for reeve, mayor, president | - | - | - |
| Totalling | 37 | 43 | 36 |
Submitted candidates grouped by age
| Name | Number of candidates | Women | Women (%) | Men | Men (%) |
|---|---|---|---|---|---|
| 18-29 | 11 | 1 | 9.09% | 10 | 90.91% |
| 30-39 | 21 | 2 | 9.52% | 19 | 90.48% |
| 40-49 | 17 | 5 | 29.41% | 12 | 70.59% |
| 50-59 | 9 | 3 | 33.33% | 6 | 66.67% |
| 60-69 | 0 | 0 | — | 0 | — |
| 70+ | 0 | 0 | — | 0 | — |
The youngest and oldest candidate submitted
| Age | Institution | |
|---|---|---|
| Youngest | 19 | Sejmik Województwa Małopolskiego |
| Oldest | 56 | Sejmik Województwa Małopolskiego |