Komitet Wyborczy Wyborców SAMORZĄDOWE POROZUMIENIE PRAWICY
| Name: | Komitet Wyborczy Wyborców SAMORZĄDOWE POROZUMIENIE PRAWICY | |
| Short name: | KWW SPP | |
| Type of committee: | Election committees established by electors | |
| Address: | ul. Kościuszki 1B/3, 49-305 Brzeg | |
| Plenipotentiary: | electoral | financial |
| Czesław Grabiński | Józef Kaczan | |
The provinces where the committee has submitted lists of candidates
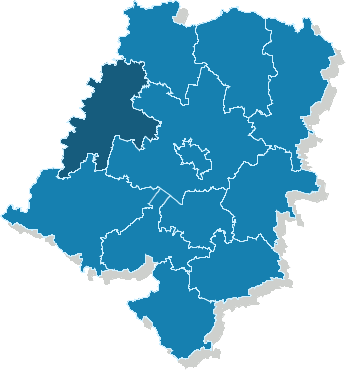
| Name |
|---|
| pow. brzeski |
The statistics of election committe
Lists submitted
| Description | Number of |
|---|---|
| Number of lists submitted for province council | 0 |
| Number of lists submitted for county councils | 4 |
| Number of lists submitted for councils of cities holding county rights | 0 |
| Number of lists submitted for districts councils of the cap. city of Warsaw | 0 |
| Number of lists registered for communal councils | 24 |
| Totalling | 28 |
Submitted candidates
| Name | Number of candidates | Women | Women (%) | Men | Men (%) |
|---|---|---|---|---|---|
| Number of candidates submitted for the province council | 0 | 0 | - | 0 | - |
| Number of candidates submitted for county councils | 29 | 5 | 17.24% | 24 | 82.76% |
| Number of candidates submitted for councils of cities holding county rights | 0 | 0 | - | 0 | - |
| Number of candidates submitted for districts councils of the cap. city of Warsaw | 0 | 0 | - | 0 | - |
| Number of candidates registered for communal councils | 59 | 9 | 15.25% | 50 | 84.75% |
| Number of candidates submitted for reeve, mayor and presidential elections | 3 | 0 | 0.00% | 3 | 100.00% |
| Totalling | 91 | 14 | 15.38% | 77 | 84.62% |
Average age of submitted candidates
| Name | Average age | Average age of women | Average age of men |
|---|---|---|---|
| Average age of candidates submitted for the province council | - | - | - |
| Average age of candidates submitted for county councils | 48 | 51 | 48 |
| Average age of candidates for councils of cities holding county rights | - | - | - |
| Average age of candidates for districts councils of the cap. city of Warsaw | - | - | - |
| Average age of candidates submitted for communal councils | 42 | 46 | 42 |
| Average age of candidates for reeve, mayor, president | 48 | - | 48 |
| Totalling | 44 | 48 | 44 |
Submitted candidates grouped by age
| Name | Number of candidates | Women | Women (%) | Men | Men (%) |
|---|---|---|---|---|---|
| 18-29 | 6 | 0 | 0.00% | 6 | 100.00% |
| 30-39 | 17 | 3 | 17.65% | 14 | 82.35% |
| 40-49 | 37 | 5 | 13.51% | 32 | 86.49% |
| 50-59 | 26 | 5 | 19.23% | 21 | 80.77% |
| 60-69 | 5 | 1 | 20.00% | 4 | 80.00% |
| 70+ | 0 | 0 | — | 0 | — |
The youngest and oldest candidate submitted
| Age | Institution | |
|---|---|---|
| Youngest | 22 | Rada Miejska w Brzegu |
| Oldest | 66 | Rada Powiatu Brzeskiego |