Komitet Wyborczy Unia Obywatelska
| Name: | Komitet Wyborczy Unia Obywatelska | |
| Short name: | KW Unia Obywatelska | |
| Type of committee: | Election committees established by organisations | |
| Address: | ul. 1 Maja 12, 47-300 Krapkowice | |
| Plenipotentiary: | electoral | financial |
| Witold Rożałowski | Elżbieta Natalia Górna | |
The provinces where the committee has submitted lists of candidates
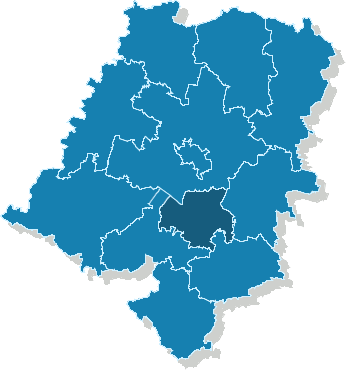
| Name |
|---|
| pow. krapkowicki |
The statistics of election committe
Lists submitted
| Description | Number of |
|---|---|
| Number of lists submitted for province council | 0 |
| Number of lists submitted for county councils | 3 |
| Number of lists submitted for councils of cities holding county rights | 0 |
| Number of lists submitted for districts councils of the cap. city of Warsaw | 0 |
| Number of lists registered for communal councils | 7 |
| Totalling | 10 |
Submitted candidates
| Name | Number of candidates | Women | Women (%) | Men | Men (%) |
|---|---|---|---|---|---|
| Number of candidates submitted for the province council | 0 | 0 | - | 0 | - |
| Number of candidates submitted for county councils | 19 | 8 | 42.11% | 11 | 57.89% |
| Number of candidates submitted for councils of cities holding county rights | 0 | 0 | - | 0 | - |
| Number of candidates submitted for districts councils of the cap. city of Warsaw | 0 | 0 | - | 0 | - |
| Number of candidates registered for communal councils | 22 | 4 | 18.18% | 18 | 81.82% |
| Number of candidates submitted for reeve, mayor and presidential elections | 0 | 0 | - | 0 | - |
| Totalling | 41 | 12 | 29.27% | 29 | 70.73% |
Average age of submitted candidates
| Name | Average age | Average age of women | Average age of men |
|---|---|---|---|
| Average age of candidates submitted for the province council | - | - | - |
| Average age of candidates submitted for county councils | 40 | 40 | 40 |
| Average age of candidates for councils of cities holding county rights | - | - | - |
| Average age of candidates for districts councils of the cap. city of Warsaw | - | - | - |
| Average age of candidates submitted for communal councils | 44 | 41 | 45 |
| Average age of candidates for reeve, mayor, president | - | - | - |
| Totalling | 42 | 41 | 43 |
Submitted candidates grouped by age
| Name | Number of candidates | Women | Women (%) | Men | Men (%) |
|---|---|---|---|---|---|
| 18-29 | 5 | 2 | 40.00% | 3 | 60.00% |
| 30-39 | 12 | 4 | 33.33% | 8 | 66.67% |
| 40-49 | 13 | 3 | 23.08% | 10 | 76.92% |
| 50-59 | 6 | 3 | 50.00% | 3 | 50.00% |
| 60-69 | 4 | 0 | 0.00% | 4 | 100.00% |
| 70+ | 1 | 0 | 0.00% | 1 | 100.00% |
The youngest and oldest candidate submitted
| Age | Institution | |
|---|---|---|
| Youngest | 23 | Rada Powiatu Krapkowickiego |
| Oldest | 71 | Rada Miejska w Krapkowicach |