Komitet Wyborczy Wyborców Powiatowe Gryfińskie Porozumienie Samorządowe
| Name: | Komitet Wyborczy Wyborców Powiatowe Gryfińskie Porozumienie Samorządowe | |
| Short name: | KWW PGPS | |
| Type of committee: | Election committees established by electors | |
| Address: | ul. Grunwaldzka 1, 74-100 Gryfino | |
| Plenipotentiary: | electoral | financial |
| Franciszek Nowak | Stanisław Uchto | |
The provinces where the committee has submitted lists of candidates
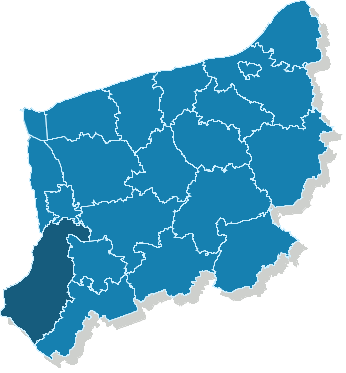
| Name |
|---|
| pow. gryfiński |
The statistics of election committe
Lists submitted
| Description | Number of |
|---|---|
| Number of lists submitted for province council | 0 |
| Number of lists submitted for county councils | 4 |
| Number of lists submitted for councils of cities holding county rights | 0 |
| Number of lists submitted for districts councils of the cap. city of Warsaw | 0 |
| Number of lists registered for communal councils | 0 |
| Totalling | 4 |
Submitted candidates
| Name | Number of candidates | Women | Women (%) | Men | Men (%) |
|---|---|---|---|---|---|
| Number of candidates submitted for the province council | 0 | 0 | - | 0 | - |
| Number of candidates submitted for county councils | 27 | 7 | 25.93% | 20 | 74.07% |
| Number of candidates submitted for councils of cities holding county rights | 0 | 0 | - | 0 | - |
| Number of candidates submitted for districts councils of the cap. city of Warsaw | 0 | 0 | - | 0 | - |
| Number of candidates registered for communal councils | 0 | 0 | - | 0 | - |
| Number of candidates submitted for reeve, mayor and presidential elections | 0 | 0 | - | 0 | - |
| Totalling | 27 | 7 | 25.93% | 20 | 74.07% |
Average age of submitted candidates
| Name | Average age | Average age of women | Average age of men |
|---|---|---|---|
| Average age of candidates submitted for the province council | - | - | - |
| Average age of candidates submitted for county councils | 52 | 48 | 53 |
| Average age of candidates for councils of cities holding county rights | - | - | - |
| Average age of candidates for districts councils of the cap. city of Warsaw | - | - | - |
| Average age of candidates submitted for communal councils | - | - | - |
| Average age of candidates for reeve, mayor, president | - | - | - |
| Totalling | 52 | 48 | 53 |
Submitted candidates grouped by age
| Name | Number of candidates | Women | Women (%) | Men | Men (%) |
|---|---|---|---|---|---|
| 18-29 | 1 | 0 | 0.00% | 1 | 100.00% |
| 30-39 | 1 | 1 | 100.00% | 0 | 0.00% |
| 40-49 | 7 | 3 | 42.86% | 4 | 57.14% |
| 50-59 | 11 | 2 | 18.18% | 9 | 81.82% |
| 60-69 | 7 | 1 | 14.29% | 6 | 85.71% |
| 70+ | 0 | 0 | — | 0 | — |
The youngest and oldest candidate submitted
| Age | Institution | |
|---|---|---|
| Youngest | 25 | Rada Powiatu w Gryfinie |
| Oldest | 66 | Rada Powiatu w Gryfinie |