Komitet Wyborczy Wyborców ZIEMIA PIŃCZOWSKA
| Name: | Komitet Wyborczy Wyborców ZIEMIA PIŃCZOWSKA | |
| Short name: | KWW Ziemia Pińczowska | |
| Type of committee: | Election committees established by electors | |
| Address: | ul. Batalionów Chłopskich 77, Pińczów | |
| Plenipotentiary: | electoral | financial |
| Stefan Marek Omasta | Janusz Bogusław Zieliński | |
The provinces where the committee has submitted lists of candidates
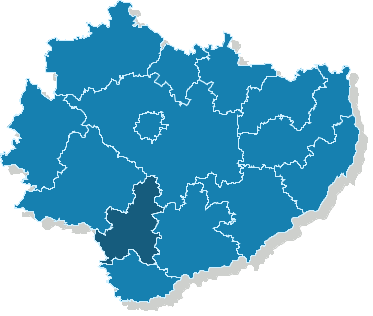
| Name |
|---|
| pow. pińczowski |
The statistics of election committe
Lists submitted
| Description | Number of |
|---|---|
| Number of lists submitted for province council | 0 |
| Number of lists submitted for county councils | 2 |
| Number of lists submitted for councils of cities holding county rights | 0 |
| Number of lists submitted for districts councils of the cap. city of Warsaw | 0 |
| Number of lists registered for communal councils | 4 |
| Totalling | 6 |
Submitted candidates
| Name | Number of candidates | Women | Women (%) | Men | Men (%) |
|---|---|---|---|---|---|
| Number of candidates submitted for the province council | 0 | 0 | - | 0 | - |
| Number of candidates submitted for county councils | 33 | 5 | 15.15% | 28 | 84.85% |
| Number of candidates submitted for councils of cities holding county rights | 0 | 0 | - | 0 | - |
| Number of candidates submitted for districts councils of the cap. city of Warsaw | 0 | 0 | - | 0 | - |
| Number of candidates registered for communal councils | 41 | 6 | 14.63% | 35 | 85.37% |
| Number of candidates submitted for reeve, mayor and presidential elections | 1 | 0 | 0.00% | 1 | 100.00% |
| Totalling | 75 | 11 | 14.67% | 64 | 85.33% |
Average age of submitted candidates
| Name | Average age | Average age of women | Average age of men |
|---|---|---|---|
| Average age of candidates submitted for the province council | - | - | - |
| Average age of candidates submitted for county councils | 44 | 44 | 44 |
| Average age of candidates for councils of cities holding county rights | - | - | - |
| Average age of candidates for districts councils of the cap. city of Warsaw | - | - | - |
| Average age of candidates submitted for communal councils | 43 | 42 | 43 |
| Average age of candidates for reeve, mayor, president | 46 | - | 46 |
| Totalling | 43 | 43 | 43 |
Submitted candidates grouped by age
| Name | Number of candidates | Women | Women (%) | Men | Men (%) |
|---|---|---|---|---|---|
| 18-29 | 6 | 0 | 0.00% | 6 | 100.00% |
| 30-39 | 19 | 4 | 21.05% | 15 | 78.95% |
| 40-49 | 28 | 5 | 17.86% | 23 | 82.14% |
| 50-59 | 17 | 2 | 11.76% | 15 | 88.24% |
| 60-69 | 5 | 0 | 0.00% | 5 | 100.00% |
| 70+ | 0 | 0 | — | 0 | — |
The youngest and oldest candidate submitted
| Age | Institution | |
|---|---|---|
| Youngest | 18 | Rada Powiatu Pińczowskiego |
| Oldest | 67 | Rada Powiatu Pińczowskiego |