Komitet Wyborczy Wyborców Świdnicka Wspólnota Samorządowa
| Name: | Komitet Wyborczy Wyborców Świdnicka Wspólnota Samorządowa | |
| Short name: | KWW Świdnicka Wspólnota Samorządowa | |
| Type of committee: | Election committees established by electors | |
| Address: | ul.Wałbrzyska 27/29 58-100 Świdnica | |
| Plenipotentiary: | electoral | financial |
| Krzysztof Czarnecki | Iwona Rosiak | |
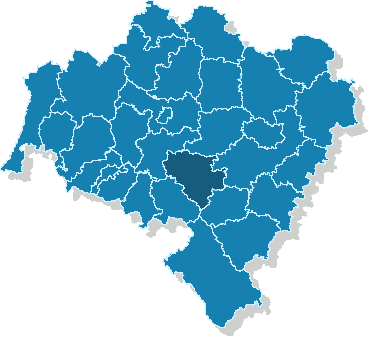
The provinces where the committee has submitted lists of candidates
| Name |
|---|
| pow. świdnicki |
The statistics of election committe
Lists submitted
| Description | Number of |
|---|---|
| Number of lists submitted for province council | 0 |
| Number of lists submitted for county councils | 6 |
| Number of lists submitted for councils of cities holding county rights | 0 |
| Number of lists submitted for districts councils of the cap. city of Warsaw | 0 |
| Number of lists registered for communal councils | 16 |
| Totalling | 22 |
Submitted candidates
| Name | Number of candidates | Women | Women (%) | Men | Men (%) |
|---|---|---|---|---|---|
| Number of candidates submitted for the province council | 0 | 0 | - | 0 | - |
| Number of candidates submitted for county councils | 54 | 14 | 25.93% | 40 | 74.07% |
| Number of candidates submitted for councils of cities holding county rights | 0 | 0 | - | 0 | - |
| Number of candidates submitted for districts councils of the cap. city of Warsaw | 0 | 0 | - | 0 | - |
| Number of candidates registered for communal councils | 99 | 32 | 32.32% | 67 | 67.68% |
| Number of candidates submitted for reeve, mayor and presidential elections | 3 | 1 | 33.33% | 2 | 66.67% |
| Totalling | 156 | 47 | 30.13% | 109 | 69.87% |
Average age of submitted candidates
| Name | Average age | Average age of women | Average age of men |
|---|---|---|---|
| Average age of candidates submitted for the province council | - | - | - |
| Average age of candidates submitted for county councils | 46 | 47 | 46 |
| Average age of candidates for councils of cities holding county rights | - | - | - |
| Average age of candidates for districts councils of the cap. city of Warsaw | - | - | - |
| Average age of candidates submitted for communal councils | 49 | 47 | 49 |
| Average age of candidates for reeve, mayor, president | 48 | 46 | 50 |
| Totalling | 48 | 47 | 48 |
Submitted candidates grouped by age
| Name | Number of candidates | Women | Women (%) | Men | Men (%) |
|---|---|---|---|---|---|
| 18-29 | 4 | 1 | 25.00% | 3 | 75.00% |
| 30-39 | 23 | 7 | 30.43% | 16 | 69.57% |
| 40-49 | 60 | 22 | 36.67% | 38 | 63.33% |
| 50-59 | 51 | 14 | 27.45% | 37 | 72.55% |
| 60-69 | 17 | 3 | 17.65% | 14 | 82.35% |
| 70+ | 1 | 0 | 0.00% | 1 | 100.00% |
The youngest and oldest candidate submitted
| Age | Institution | |
|---|---|---|
| Youngest | 22 | Rada Powiatu w Świdnicy |
| Oldest | 70 | Rada Miejska w Świdnicy |