Komitet Wyborczy Wyborców "Demokratyczny Samorząd"
| Name: | Komitet Wyborczy Wyborców "Demokratyczny Samorząd" | |
| Short name: | KWW "Demokratyczny Samorząd" | |
| Type of committee: | Election committees established by electors | |
| Address: | ul. Mogielnicka 30D, 05-600 Grójec | |
| Plenipotentiary: | electoral | financial |
| Bogusław Grzanka | Kazimierz Rdzanek | |
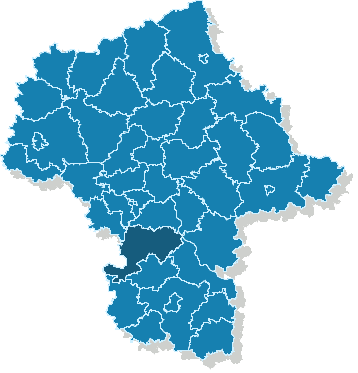
The provinces where the committee has submitted lists of candidates
| Name |
|---|
| pow. grójecki |
The statistics of election committe
Lists submitted
| Description | Number of |
|---|---|
| Number of lists submitted for province council | 0 |
| Number of lists submitted for county councils | 5 |
| Number of lists submitted for councils of cities holding county rights | 0 |
| Number of lists submitted for districts councils of the cap. city of Warsaw | 0 |
| Number of lists registered for communal councils | 18 |
| Totalling | 23 |
Submitted candidates
| Name | Number of candidates | Women | Women (%) | Men | Men (%) |
|---|---|---|---|---|---|
| Number of candidates submitted for the province council | 0 | 0 | - | 0 | - |
| Number of candidates submitted for county councils | 20 | 2 | 10.00% | 18 | 90.00% |
| Number of candidates submitted for councils of cities holding county rights | 0 | 0 | - | 0 | - |
| Number of candidates submitted for districts councils of the cap. city of Warsaw | 0 | 0 | - | 0 | - |
| Number of candidates registered for communal councils | 48 | 20 | 41.67% | 28 | 58.33% |
| Number of candidates submitted for reeve, mayor and presidential elections | 1 | 0 | 0.00% | 1 | 100.00% |
| Totalling | 69 | 22 | 31.88% | 47 | 68.12% |
Average age of submitted candidates
| Name | Average age | Average age of women | Average age of men |
|---|---|---|---|
| Average age of candidates submitted for the province council | - | - | - |
| Average age of candidates submitted for county councils | 48 | 50 | 48 |
| Average age of candidates for councils of cities holding county rights | - | - | - |
| Average age of candidates for districts councils of the cap. city of Warsaw | - | - | - |
| Average age of candidates submitted for communal councils | 44 | 47 | 42 |
| Average age of candidates for reeve, mayor, president | 52 | - | 52 |
| Totalling | 46 | 47 | 45 |
Submitted candidates grouped by age
| Name | Number of candidates | Women | Women (%) | Men | Men (%) |
|---|---|---|---|---|---|
| 18-29 | 5 | 0 | 0.00% | 5 | 100.00% |
| 30-39 | 17 | 5 | 29.41% | 12 | 70.59% |
| 40-49 | 15 | 8 | 53.33% | 7 | 46.67% |
| 50-59 | 25 | 8 | 32.00% | 17 | 68.00% |
| 60-69 | 6 | 1 | 16.67% | 5 | 83.33% |
| 70+ | 1 | 0 | 0.00% | 1 | 100.00% |
The youngest and oldest candidate submitted
| Age | Institution | |
|---|---|---|
| Youngest | 22 | Rada Miejska w Grójcu |
| Oldest | 71 | Rada Powiatu Grójeckiego |