Komitet Wyborczy Wyborców Porozumienie Wyborcze
| Name: | Komitet Wyborczy Wyborców Porozumienie Wyborcze | |
| Short name: | KWW PW | |
| Type of committee: | Election committees established by electors | |
| Address: | ul. Wieniawskiego 4, 78-200 Białogard | |
| Plenipotentiary: | electoral | financial |
| Paweł Marcinkowski | Arkadiusz Adam Stasiorek | |
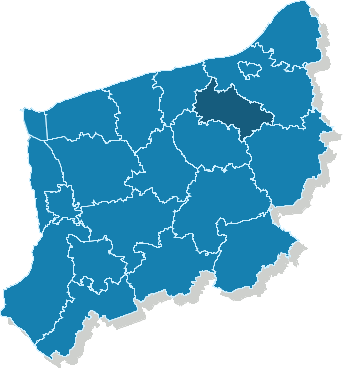
The provinces where the committee has submitted lists of candidates
| Name |
|---|
| pow. białogardzki |
The statistics of election committe
Lists submitted
| Description | Number of |
|---|---|
| Number of lists submitted for province council | 0 |
| Number of lists submitted for county councils | 3 |
| Number of lists submitted for councils of cities holding county rights | 0 |
| Number of lists submitted for districts councils of the cap. city of Warsaw | 0 |
| Number of lists registered for communal councils | 11 |
| Totalling | 14 |
Submitted candidates
| Name | Number of candidates | Women | Women (%) | Men | Men (%) |
|---|---|---|---|---|---|
| Number of candidates submitted for the province council | 0 | 0 | - | 0 | - |
| Number of candidates submitted for county councils | 21 | 3 | 14.29% | 18 | 85.71% |
| Number of candidates submitted for councils of cities holding county rights | 0 | 0 | - | 0 | - |
| Number of candidates submitted for districts councils of the cap. city of Warsaw | 0 | 0 | - | 0 | - |
| Number of candidates registered for communal councils | 29 | 13 | 44.83% | 16 | 55.17% |
| Number of candidates submitted for reeve, mayor and presidential elections | 2 | 0 | 0.00% | 2 | 100.00% |
| Totalling | 52 | 16 | 30.77% | 36 | 69.23% |
Average age of submitted candidates
| Name | Average age | Average age of women | Average age of men |
|---|---|---|---|
| Average age of candidates submitted for the province council | - | - | - |
| Average age of candidates submitted for county councils | 39 | 42 | 38 |
| Average age of candidates for councils of cities holding county rights | - | - | - |
| Average age of candidates for districts councils of the cap. city of Warsaw | - | - | - |
| Average age of candidates submitted for communal councils | 38 | 38 | 38 |
| Average age of candidates for reeve, mayor, president | 34 | - | 34 |
| Totalling | 38 | 39 | 38 |
Submitted candidates grouped by age
| Name | Number of candidates | Women | Women (%) | Men | Men (%) |
|---|---|---|---|---|---|
| 18-29 | 6 | 3 | 50.00% | 3 | 50.00% |
| 30-39 | 24 | 6 | 25.00% | 18 | 75.00% |
| 40-49 | 11 | 3 | 27.27% | 8 | 72.73% |
| 50-59 | 11 | 4 | 36.36% | 7 | 63.64% |
| 60-69 | 0 | 0 | — | 0 | — |
| 70+ | 0 | 0 | — | 0 | — |
The youngest and oldest candidate submitted
| Age | Institution | |
|---|---|---|
| Youngest | 19 | Rada Miejska Białogardu |
| Oldest | 57 | Rada Gminy Białogard |