Komitet Wyborczy Wspólnoty Samorządowej Województwa Mazowieckiego
| Name: | Komitet Wyborczy Wspólnoty Samorządowej Województwa Mazowieckiego | |
| Short name: | KW Mazowiecka Wspólnota Samorządowa | |
| Type of committee: | Election committees established by organisations | |
| Address: | ul. Tamka 38 lok.903, 00-355 Warszawa | |
| Plenipotentiary: | electoral | financial |
| Grzegorz Waldemar Szuplewski | Andrzej Wacław Szczurowski | |
The provinces where the committee has submitted lists of candidates
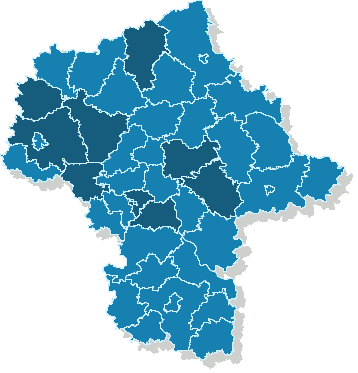
| Name |
|---|
| pow. miński |
| pow. piaseczyński |
| pow. płocki |
| pow. płoński |
| pow. pruszkowski |
| pow. przasnyski |
| pow. sierpecki |
| pow. sochaczewski |
| pow. wołomiński |
Sejmik Województwa Mazowieckiego
Submitted candidates
| Name | Number of candidates | Women | Women (%) | Men | Men (%) | Status |
|---|---|---|---|---|---|---|
| Sum: | 78 | 26 | 33.33% | 52 | 66.67% | |
| Constituency no. 1 | 10 | 3 | 30.00% | 7 | 70.00% |
|
| Constituency no. 2 | 11 | 5 | 45.45% | 6 | 54.55% |
|
| Constituency no. 3 | 12 | 3 | 25.00% | 9 | 75.00% |
|
| Constituency no. 4 | 11 | 5 | 45.45% | 6 | 54.55% |
|
| Constituency no. 5 | 11 | 4 | 36.36% | 7 | 63.64% |
|
| Constituency no. 6 | 10 | 4 | 40.00% | 6 | 60.00% |
|
| Constituency no. 7 | 13 | 2 | 15.38% | 11 | 84.62% |
|
Age of the candidates
| Name | Average age | Average age of women | Average age of men | Oldest | Youngest |
|---|---|---|---|---|---|
| Constituency no. 1 | 45 | 52 | 42 | 68 | 21 |
| Constituency no. 2 | 49 | 42 | 55 | 67 | 33 |
| Constituency no. 3 | 53 | 44 | 55 | 68 | 29 |
| Constituency no. 4 | 43 | 47 | 39 | 70 | 22 |
| Constituency no. 5 | 43 | 49 | 40 | 64 | 23 |
| Constituency no. 6 | 48 | 42 | 53 | 65 | 30 |
| Constituency no. 7 | 54 | 64 | 53 | 69 | 31 |
The statistics of election committe
Lists submitted
| Description | Number of |
|---|---|
| Number of lists submitted for province council | 7 |
| Number of lists submitted for county councils | 29 |
| Number of lists submitted for councils of cities holding county rights | 0 |
| Number of lists submitted for districts councils of the cap. city of Warsaw | 0 |
| Number of lists registered for communal councils | 161 |
| Totalling | 197 |
Submitted candidates
| Name | Number of candidates | Women | Women (%) | Men | Men (%) |
|---|---|---|---|---|---|
| Number of candidates submitted for the province council | 78 | 26 | 33.33% | 52 | 66.67% |
| Number of candidates submitted for county councils | 247 | 87 | 35.22% | 160 | 64.78% |
| Number of candidates submitted for councils of cities holding county rights | 0 | 0 | - | 0 | - |
| Number of candidates submitted for districts councils of the cap. city of Warsaw | 0 | 0 | - | 0 | - |
| Number of candidates registered for communal councils | 373 | 133 | 35.66% | 240 | 64.34% |
| Number of candidates submitted for reeve, mayor and presidential elections | 11 | 0 | 0.00% | 11 | 100.00% |
| Totalling | 709 | 246 | 34.70% | 463 | 65.30% |
Average age of submitted candidates
| Name | Average age | Average age of women | Average age of men |
|---|---|---|---|
| Average age of candidates submitted for the province council | 48 | 47 | 49 |
| Average age of candidates submitted for county councils | 46 | 45 | 46 |
| Average age of candidates for councils of cities holding county rights | - | - | - |
| Average age of candidates for districts councils of the cap. city of Warsaw | - | - | - |
| Average age of candidates submitted for communal councils | 45 | 44 | 45 |
| Average age of candidates for reeve, mayor, president | 47 | - | 47 |
| Totalling | 45 | 45 | 46 |
Submitted candidates grouped by age
| Name | Number of candidates | Women | Women (%) | Men | Men (%) |
|---|---|---|---|---|---|
| 18-29 | 73 | 26 | 35.62% | 47 | 64.38% |
| 30-39 | 131 | 45 | 34.35% | 86 | 65.65% |
| 40-49 | 222 | 89 | 40.09% | 133 | 59.91% |
| 50-59 | 199 | 60 | 30.15% | 139 | 69.85% |
| 60-69 | 71 | 21 | 29.58% | 50 | 70.42% |
| 70+ | 13 | 5 | 38.46% | 8 | 61.54% |
The youngest and oldest candidate submitted
| Age | Institution | |
|---|---|---|
| Youngest | 19 | Rada Miejska w Piasecznie |
| Oldest | 81 | Rada Miasta Ząbki |