Komitet Wyborczy Platforma Obywatelska RP
| Name: | Komitet Wyborczy Platforma Obywatelska RP | |
| Short name: | KW Platforma Obywatelska RP | |
| Type of committee: | Election committees established by political parties | |
| Address: | ul. Andersa 21, 00-159 Warszawa | |
| Plenipotentiary: | electoral | financial |
| Jacek Wojciechowicz | Andrzej Włodzimierz Wyrobiec | |
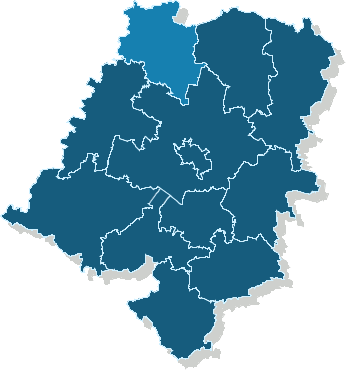
The provinces where the committee has submitted lists of candidates
| Name |
|---|
| m. Opole |
| pow. brzeski |
| pow. głubczycki |
| pow. kędzierzyńsko-kozielski |
| pow. kluczborski |
| pow. krapkowicki |
| pow. nyski |
| pow. oleski |
| pow. opolski |
| pow. prudnicki |
| pow. strzelecki |
Sejmik Województwa Opolskiego
Submitted candidates
| Name | Number of candidates | Women | Women (%) | Men | Men (%) | Status |
|---|---|---|---|---|---|---|
| Sum: | 40 | 3 | 7.50% | 37 | 92.50% | |
| Constituency no. 1 | 9 | 3 | 33.33% | 6 | 66.67% |
|
| Constituency no. 2 | 12 | 0 | 0.00% | 12 | 100.00% |
|
| Constituency no. 3 | 5 | 0 | 0.00% | 5 | 100.00% |
|
| Constituency no. 4 | 7 | 0 | 0.00% | 7 | 100.00% |
|
| Constituency no. 5 | 7 | 0 | 0.00% | 7 | 100.00% |
|
Age of the candidates
| Name | Average age | Average age of women | Average age of men | Oldest | Youngest |
|---|---|---|---|---|---|
| Constituency no. 1 | 44 | 42 | 45 | 61 | 21 |
| Constituency no. 2 | 40 | 40 | 58 | 21 | |
| Constituency no. 3 | 46 | 46 | 61 | 22 | |
| Constituency no. 4 | 43 | 43 | 55 | 39 | |
| Constituency no. 5 | 41 | 41 | 51 | 29 |
The statistics of election committe
Lists submitted
| Description | Number of |
|---|---|
| Number of lists submitted for province council | 5 |
| Number of lists submitted for county councils | 38 |
| Number of lists submitted for councils of cities holding county rights | 5 |
| Number of lists registered for communal councils | 103 |
| Totalling | 151 |
Submitted candidates
| Name | Number of candidates | Women | Women (%) | Men | Men (%) |
|---|---|---|---|---|---|
| Number of candidates submitted for the province council | 40 | 3 | 7.50% | 37 | 92.50% |
| Number of candidates submitted for county councils | 248 | 68 | 27.42% | 180 | 72.58% |
| Number of candidates submitted for councils of cities holding county rights | 49 | 13 | 26.53% | 36 | 73.47% |
| Number of candidates registered for communal councils | 342 | 93 | 27.19% | 249 | 72.81% |
| Number of candidates submitted for reeve, mayor and presidential elections | 14 | 4 | 28.57% | 10 | 71.43% |
| Totalling | 693 | 181 | 26.12% | 512 | 73.88% |
Average age of submitted candidates
| Name | Average age | Average age of women | Average age of men |
|---|---|---|---|
| Average age of candidates submitted for the province council | 42 | 42 | 42 |
| Average age of candidates submitted for county councils | 41 | 41 | 41 |
| Average age of candidates for councils of cities holding county rights | 38 | 41 | 38 |
| Average age of candidates submitted for communal councils | 40 | 41 | 39 |
| Average age of candidates for reeve, mayor, president | 45 | 47 | 44 |
| Totalling | 40 | 41 | 40 |
Submitted candidates grouped by age
| Name | Number of candidates | Women | Women (%) | Men | Men (%) |
|---|---|---|---|---|---|
| 18-29 | 134 | 31 | 23.13% | 103 | 76.87% |
| 30-39 | 180 | 46 | 25.56% | 134 | 74.44% |
| 40-49 | 219 | 60 | 27.40% | 159 | 72.60% |
| 50-59 | 130 | 36 | 27.69% | 94 | 72.31% |
| 60-69 | 27 | 7 | 25.93% | 20 | 74.07% |
| 70+ | 3 | 1 | 33.33% | 2 | 66.67% |
The youngest and oldest candidate submitted
| Age | Institution | |
|---|---|---|
| Youngest | 18 | Rada Miasta Opola |
| Oldest | 75 | Rada Miejska w Krapkowicach |