Komitet Wyborczy Wyborców LEŚNICY DLA REGIONU
| Name: | Komitet Wyborczy Wyborców LEŚNICY DLA REGIONU | |
| Short name: | KWW LEŚNICY DLA REGIONU | |
| Type of committee: | Election committees established by electors | |
| Address: | ul. Wąska 2, 83-424 Lipusz | |
| Plenipotentiary: | electoral | financial |
| Grażyna Maria Wantoch Rekowska | Teresa Gruchała | |
The provinces where the committee has submitted lists of candidates
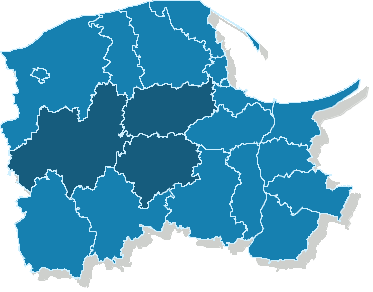
| Name |
|---|
| pow. bytowski |
| pow. kartuski |
| pow. kościerski |
The statistics of election committe
Lists submitted
| Description | Number of |
|---|---|
| Number of lists submitted for province council | 0 |
| Number of lists submitted for county councils | 3 |
| Number of lists submitted for councils of cities holding county rights | 0 |
| Number of lists submitted for districts councils of the cap. city of Warsaw | 0 |
| Number of lists registered for communal councils | 13 |
| Totalling | 16 |
Submitted candidates
| Name | Number of candidates | Women | Women (%) | Men | Men (%) |
|---|---|---|---|---|---|
| Number of candidates submitted for the province council | 0 | 0 | - | 0 | - |
| Number of candidates submitted for county councils | 12 | 1 | 8.33% | 11 | 91.67% |
| Number of candidates submitted for councils of cities holding county rights | 0 | 0 | - | 0 | - |
| Number of candidates submitted for districts councils of the cap. city of Warsaw | 0 | 0 | - | 0 | - |
| Number of candidates registered for communal councils | 20 | 0 | 0.00% | 20 | 100.00% |
| Number of candidates submitted for reeve, mayor and presidential elections | 0 | 0 | - | 0 | - |
| Totalling | 32 | 1 | 3.12% | 31 | 96.88% |
Average age of submitted candidates
| Name | Average age | Average age of women | Average age of men |
|---|---|---|---|
| Average age of candidates submitted for the province council | - | - | - |
| Average age of candidates submitted for county councils | 45 | 33 | 46 |
| Average age of candidates for councils of cities holding county rights | - | - | - |
| Average age of candidates for districts councils of the cap. city of Warsaw | - | - | - |
| Average age of candidates submitted for communal councils | 43 | - | 43 |
| Average age of candidates for reeve, mayor, president | - | - | - |
| Totalling | 44 | 33 | 44 |
Submitted candidates grouped by age
| Name | Number of candidates | Women | Women (%) | Men | Men (%) |
|---|---|---|---|---|---|
| 18-29 | 0 | 0 | — | 0 | — |
| 30-39 | 11 | 1 | 9.09% | 10 | 90.91% |
| 40-49 | 11 | 0 | 0.00% | 11 | 100.00% |
| 50-59 | 8 | 0 | 0.00% | 8 | 100.00% |
| 60-69 | 1 | 0 | 0.00% | 1 | 100.00% |
| 70+ | 1 | 0 | 0.00% | 1 | 100.00% |
The youngest and oldest candidate submitted
| Age | Institution | |
|---|---|---|
| Youngest | 31 | Rada Gminy Sulęczyno |
| Oldest | 71 | Rada Powiatu Kościerskiego |