Komitet Wyborczy Wyborców Samorządowo-Ludowy
| Name: | Komitet Wyborczy Wyborców Samorządowo-Ludowy | |
| Short name: | KWW S-L | |
| Type of committee: | Election committees established by electors | |
| Address: | Kamienna Wola 57, 26-425 Odrzywół | |
| Plenipotentiary: | electoral | financial |
| Zbigniew Kwiatkowski | Sławomir Waldemar Wiktorowicz | |
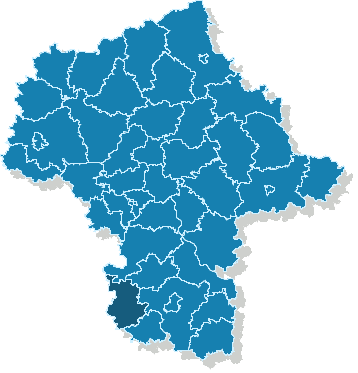
The provinces where the committee has submitted lists of candidates
| Name |
|---|
| pow. przysuski |
The statistics of election committe
Lists submitted
| Description | Number of |
|---|---|
| Number of lists submitted for province council | 0 |
| Number of lists submitted for county councils | 4 |
| Number of lists submitted for councils of cities holding county rights | 0 |
| Number of lists submitted for districts councils of the cap. city of Warsaw | 0 |
| Number of lists registered for communal councils | 10 |
| Totalling | 14 |
Submitted candidates
| Name | Number of candidates | Women | Women (%) | Men | Men (%) |
|---|---|---|---|---|---|
| Number of candidates submitted for the province council | 0 | 0 | - | 0 | - |
| Number of candidates submitted for county councils | 33 | 5 | 15.15% | 28 | 84.85% |
| Number of candidates submitted for councils of cities holding county rights | 0 | 0 | - | 0 | - |
| Number of candidates submitted for districts councils of the cap. city of Warsaw | 0 | 0 | - | 0 | - |
| Number of candidates registered for communal councils | 11 | 1 | 9.09% | 10 | 90.91% |
| Number of candidates submitted for reeve, mayor and presidential elections | 1 | 0 | 0.00% | 1 | 100.00% |
| Totalling | 45 | 6 | 13.33% | 39 | 86.67% |
Average age of submitted candidates
| Name | Average age | Average age of women | Average age of men |
|---|---|---|---|
| Average age of candidates submitted for the province council | - | - | - |
| Average age of candidates submitted for county councils | 44 | 47 | 44 |
| Average age of candidates for councils of cities holding county rights | - | - | - |
| Average age of candidates for districts councils of the cap. city of Warsaw | - | - | - |
| Average age of candidates submitted for communal councils | 47 | 31 | 48 |
| Average age of candidates for reeve, mayor, president | 38 | - | 38 |
| Totalling | 45 | 45 | 45 |
Submitted candidates grouped by age
| Name | Number of candidates | Women | Women (%) | Men | Men (%) |
|---|---|---|---|---|---|
| 18-29 | 2 | 0 | 0.00% | 2 | 100.00% |
| 30-39 | 10 | 2 | 20.00% | 8 | 80.00% |
| 40-49 | 21 | 2 | 9.52% | 19 | 90.48% |
| 50-59 | 11 | 2 | 18.18% | 9 | 81.82% |
| 60-69 | 1 | 0 | 0.00% | 1 | 100.00% |
| 70+ | 0 | 0 | — | 0 | — |
The youngest and oldest candidate submitted
| Age | Institution | |
|---|---|---|
| Youngest | 25 | Rada Gminy i Miasta w Przysusze |
| Oldest | 60 | Rada Gminy i Miasta w Przysusze |