Komitet Wyborczy Wyborców Forum Samorządowe "Pałuki"
| Name: | Komitet Wyborczy Wyborców Forum Samorządowe "Pałuki" | |
| Short name: | KWW Forum Samorządowe "Pałuki" | |
| Type of committee: | Election committees established by electors | |
| Address: | Mickiewicza 37, 88-400, Żnin | |
| Plenipotentiary: | electoral | financial |
| Jacek Jan Pietraszko | Janusz Tadeusz Sobczak | |
The provinces where the committee has submitted lists of candidates
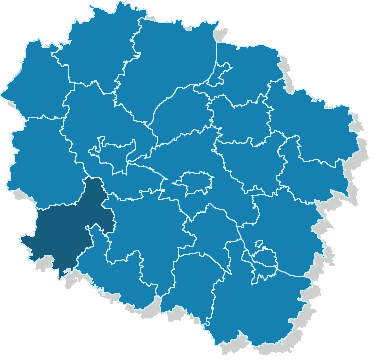
| Name |
|---|
| pow. żniński |
The statistics of election committe
Lists submitted
| Description | Number of |
|---|---|
| Number of lists submitted for province council | 0 |
| Number of lists submitted for county councils | 3 |
| Number of lists submitted for councils of cities holding county rights | 0 |
| Number of lists submitted for districts councils of the cap. city of Warsaw | 0 |
| Number of lists registered for communal councils | 4 |
| Totalling | 7 |
Submitted candidates
| Name | Number of candidates | Women | Women (%) | Men | Men (%) |
|---|---|---|---|---|---|
| Number of candidates submitted for the province council | 0 | 0 | - | 0 | - |
| Number of candidates submitted for county councils | 28 | 8 | 28.57% | 20 | 71.43% |
| Number of candidates submitted for councils of cities holding county rights | 0 | 0 | - | 0 | - |
| Number of candidates submitted for districts councils of the cap. city of Warsaw | 0 | 0 | - | 0 | - |
| Number of candidates registered for communal councils | 38 | 2 | 5.26% | 36 | 94.74% |
| Number of candidates submitted for reeve, mayor and presidential elections | 1 | 0 | 0.00% | 1 | 100.00% |
| Totalling | 67 | 10 | 14.93% | 57 | 85.07% |
Average age of submitted candidates
| Name | Average age | Average age of women | Average age of men |
|---|---|---|---|
| Average age of candidates submitted for the province council | - | - | - |
| Average age of candidates submitted for county councils | 46 | 52 | 44 |
| Average age of candidates for councils of cities holding county rights | - | - | - |
| Average age of candidates for districts councils of the cap. city of Warsaw | - | - | - |
| Average age of candidates submitted for communal councils | 46 | 38 | 47 |
| Average age of candidates for reeve, mayor, president | 57 | - | 57 |
| Totalling | 47 | 49 | 46 |
Submitted candidates grouped by age
| Name | Number of candidates | Women | Women (%) | Men | Men (%) |
|---|---|---|---|---|---|
| 18-29 | 6 | 0 | 0.00% | 6 | 100.00% |
| 30-39 | 10 | 2 | 20.00% | 8 | 80.00% |
| 40-49 | 21 | 4 | 19.05% | 17 | 80.95% |
| 50-59 | 22 | 2 | 9.09% | 20 | 90.91% |
| 60-69 | 8 | 2 | 25.00% | 6 | 75.00% |
| 70+ | 0 | 0 | — | 0 | — |
The youngest and oldest candidate submitted
| Age | Institution | |
|---|---|---|
| Youngest | 22 | Rada Powiatu Żnińskiego |
| Oldest | 69 | Rada Miejska w Żninie |