Komitet Wyborczy Ruch Autonomii Śląska
| Name: | Komitet Wyborczy Ruch Autonomii Śląska | |
| Short name: | KW Ruch Autonomii Śląska | |
| Type of committee: | Election committees established by organisations | |
| Address: | Plac Wolności 7, 44-200 Rybnik | |
| Plenipotentiary: | electoral | financial |
| Marek Marcisz | Leon Swaczyna | |
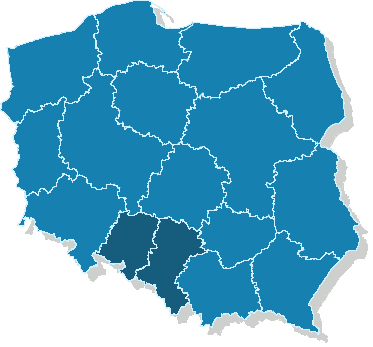
| Name |
|---|
| woj. opolskie |
| woj. śląskie |
The statistics of election committe
Lists submitted
| Description | Number of |
|---|---|
| Number of lists submitted for province council | 12 |
| Number of lists submitted for county councils | 8 |
| Number of lists submitted for councils of cities holding county rights | 5 |
| Number of lists submitted for districts councils of the cap. city of Warsaw | 0 |
| Number of lists registered for communal councils | 32 |
| Totalling | 57 |
Submitted candidates
| Name | Number of candidates | Women | Women (%) | Men | Men (%) |
|---|---|---|---|---|---|
| Number of candidates submitted for the province council | 95 | 18 | 18.95% | 77 | 81.05% |
| Number of candidates submitted for county councils | 45 | 9 | 20.00% | 36 | 80.00% |
| Number of candidates submitted for councils of cities holding county rights | 32 | 3 | 9.38% | 29 | 90.62% |
| Number of candidates submitted for districts councils of the cap. city of Warsaw | 0 | 0 | - | 0 | - |
| Number of candidates registered for communal councils | 96 | 18 | 18.75% | 78 | 81.25% |
| Number of candidates submitted for reeve, mayor and presidential elections | 5 | 0 | 0.00% | 5 | 100.00% |
| Totalling | 273 | 48 | 17.58% | 225 | 82.42% |
Average age of submitted candidates
| Name | Average age | Average age of women | Average age of men |
|---|---|---|---|
| Average age of candidates submitted for the province council | 40 | 46 | 39 |
| Average age of candidates submitted for county councils | 42 | 45 | 41 |
| Average age of candidates for councils of cities holding county rights | 40 | 50 | 39 |
| Average age of candidates for districts councils of the cap. city of Warsaw | - | - | - |
| Average age of candidates submitted for communal councils | 45 | 43 | 46 |
| Average age of candidates for reeve, mayor, president | 45 | - | 45 |
| Totalling | 42 | 45 | 42 |
Submitted candidates grouped by age
| Name | Number of candidates | Women | Women (%) | Men | Men (%) |
|---|---|---|---|---|---|
| 18-29 | 46 | 5 | 10.87% | 41 | 89.13% |
| 30-39 | 76 | 11 | 14.47% | 65 | 85.53% |
| 40-49 | 53 | 14 | 26.42% | 39 | 73.58% |
| 50-59 | 71 | 11 | 15.49% | 60 | 84.51% |
| 60-69 | 23 | 5 | 21.74% | 18 | 78.26% |
| 70+ | 4 | 2 | 50.00% | 2 | 50.00% |
The youngest and oldest candidate submitted
| Age | Institution | |
|---|---|---|
| Youngest | 19 | Rada Powiatu Strzeleckiego |
| Oldest | 81 | Sejmik Województwa Śląskiego |