Komitet Wyborczy Wyborców OBYWATELSKA WSPÓLNOTA SAMORZĄDOWA
| Name: | Komitet Wyborczy Wyborców OBYWATELSKA WSPÓLNOTA SAMORZĄDOWA | |
| Short name: | KWW OBYWATELSKA WSPÓLNOTA SAMORZĄDOWA | |
| Type of committee: | Election committees established by electors | |
| Address: | ul. Babiogórska 69, 43-300 Bielsko-Biała | |
| Plenipotentiary: | electoral | financial |
| Kazimierz Andrzej Polok | Marek Jacek Kłaptocz | |
The provinces where the committee has submitted lists of candidates
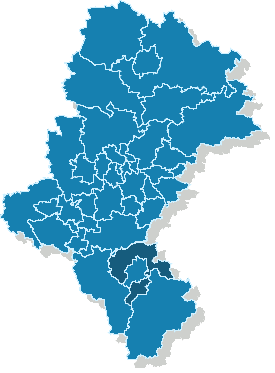
| Name |
|---|
| pow. bielski |
The statistics of election committe
Lists submitted
| Description | Number of |
|---|---|
| Number of lists submitted for province council | 0 |
| Number of lists submitted for county councils | 5 |
| Number of lists submitted for councils of cities holding county rights | 0 |
| Number of lists submitted for districts councils of the cap. city of Warsaw | 0 |
| Number of lists registered for communal councils | 11 |
| Totalling | 16 |
Submitted candidates
| Name | Number of candidates | Women | Women (%) | Men | Men (%) |
|---|---|---|---|---|---|
| Number of candidates submitted for the province council | 0 | 0 | - | 0 | - |
| Number of candidates submitted for county councils | 29 | 7 | 24.14% | 22 | 75.86% |
| Number of candidates submitted for councils of cities holding county rights | 0 | 0 | - | 0 | - |
| Number of candidates submitted for districts councils of the cap. city of Warsaw | 0 | 0 | - | 0 | - |
| Number of candidates registered for communal councils | 41 | 18 | 43.90% | 23 | 56.10% |
| Number of candidates submitted for reeve, mayor and presidential elections | 2 | 1 | 50.00% | 1 | 50.00% |
| Totalling | 72 | 26 | 36.11% | 46 | 63.89% |
Average age of submitted candidates
| Name | Average age | Average age of women | Average age of men |
|---|---|---|---|
| Average age of candidates submitted for the province council | - | - | - |
| Average age of candidates submitted for county councils | 43 | 46 | 42 |
| Average age of candidates for councils of cities holding county rights | - | - | - |
| Average age of candidates for districts councils of the cap. city of Warsaw | - | - | - |
| Average age of candidates submitted for communal councils | 43 | 43 | 44 |
| Average age of candidates for reeve, mayor, president | 52 | 45 | 59 |
| Totalling | 43 | 44 | 43 |
Submitted candidates grouped by age
| Name | Number of candidates | Women | Women (%) | Men | Men (%) |
|---|---|---|---|---|---|
| 18-29 | 12 | 5 | 41.67% | 7 | 58.33% |
| 30-39 | 14 | 3 | 21.43% | 11 | 78.57% |
| 40-49 | 22 | 9 | 40.91% | 13 | 59.09% |
| 50-59 | 19 | 7 | 36.84% | 12 | 63.16% |
| 60-69 | 3 | 2 | 66.67% | 1 | 33.33% |
| 70+ | 2 | 0 | 0.00% | 2 | 100.00% |
The youngest and oldest candidate submitted
| Age | Institution | |
|---|---|---|
| Youngest | 19 | Rada Miejska w Czechowicach-Dziedzicach |
| Oldest | 75 | Rada Gminy Wilkowice |