Komitet Wyborczy Wyborców Nasze Podlasie
| Name: | Komitet Wyborczy Wyborców Nasze Podlasie | |
| Short name: | KWW Nasze Podlasie | |
| Type of committee: | Election committees established by electors | |
| Address: | ul. Elektryczna 8, 15-080 Białystok | |
| Plenipotentiary: | electoral | financial |
| Daniel Michaluk | Tomasz Surynowicz | |
The provinces where the committee has submitted lists of candidates
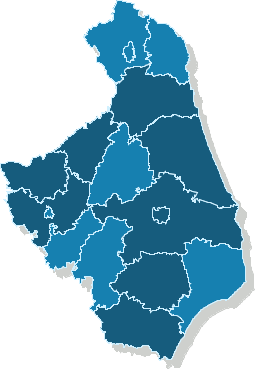
| Name |
|---|
| m. Białystok |
| pow. augustowski |
| pow. białostocki |
| pow. bielski |
| pow. grajewski |
| pow. kolneński |
| pow. łomżyński |
| pow. siemiatycki |
| pow. sokólski |
Sejmik Województwa Podlaskiego
Submitted candidates
| Name | Number of candidates | Women | Women (%) | Men | Men (%) | Status |
|---|---|---|---|---|---|---|
| Sum: | 36 | 9 | 25.00% | 27 | 75.00% | |
| Constituency no. 1 | 8 | 1 | 12.50% | 7 | 87.50% |
|
| Constituency no. 2 | 5 | 3 | 60.00% | 2 | 40.00% |
|
| Constituency no. 3 | 7 | 2 | 28.57% | 5 | 71.43% |
|
| Constituency no. 4 | 9 | 2 | 22.22% | 7 | 77.78% |
|
| Constituency no. 5 | 7 | 1 | 14.29% | 6 | 85.71% |
|
Age of the candidates
| Name | Average age | Average age of women | Average age of men | Oldest | Youngest |
|---|---|---|---|---|---|
| Constituency no. 1 | 46 | 29 | 48 | 55 | 29 |
| Constituency no. 2 | 44 | 48 | 39 | 50 | 32 |
| Constituency no. 3 | 55 | 63 | 52 | 83 | 31 |
| Constituency no. 4 | 51 | 45 | 52 | 76 | 38 |
| Constituency no. 5 | 43 | 52 | 42 | 52 | 34 |
The statistics of election committe
Lists submitted
| Description | Number of |
|---|---|
| Number of lists submitted for province council | 5 |
| Number of lists submitted for county councils | 15 |
| Number of lists submitted for councils of cities holding county rights | 5 |
| Number of lists submitted for districts councils of the cap. city of Warsaw | 0 |
| Number of lists registered for communal councils | 137 |
| Totalling | 162 |
Submitted candidates
| Name | Number of candidates | Women | Women (%) | Men | Men (%) |
|---|---|---|---|---|---|
| Number of candidates submitted for the province council | 36 | 9 | 25.00% | 27 | 75.00% |
| Number of candidates submitted for county councils | 105 | 32 | 30.48% | 73 | 69.52% |
| Number of candidates submitted for councils of cities holding county rights | 31 | 10 | 32.26% | 21 | 67.74% |
| Number of candidates submitted for districts councils of the cap. city of Warsaw | 0 | 0 | - | 0 | - |
| Number of candidates registered for communal councils | 223 | 52 | 23.32% | 171 | 76.68% |
| Number of candidates submitted for reeve, mayor and presidential elections | 10 | 2 | 20.00% | 8 | 80.00% |
| Totalling | 405 | 105 | 25.93% | 300 | 74.07% |
Average age of submitted candidates
| Name | Average age | Average age of women | Average age of men |
|---|---|---|---|
| Average age of candidates submitted for the province council | 48 | 49 | 48 |
| Average age of candidates submitted for county councils | 47 | 45 | 48 |
| Average age of candidates for councils of cities holding county rights | 37 | 41 | 35 |
| Average age of candidates for districts councils of the cap. city of Warsaw | - | - | - |
| Average age of candidates submitted for communal councils | 44 | 40 | 45 |
| Average age of candidates for reeve, mayor, president | 45 | 49 | 44 |
| Totalling | 45 | 42 | 45 |
Submitted candidates grouped by age
| Name | Number of candidates | Women | Women (%) | Men | Men (%) |
|---|---|---|---|---|---|
| 18-29 | 33 | 13 | 39.39% | 20 | 60.61% |
| 30-39 | 83 | 24 | 28.92% | 59 | 71.08% |
| 40-49 | 164 | 46 | 28.05% | 118 | 71.95% |
| 50-59 | 100 | 19 | 19.00% | 81 | 81.00% |
| 60-69 | 22 | 3 | 13.64% | 19 | 86.36% |
| 70+ | 3 | 0 | 0.00% | 3 | 100.00% |
The youngest and oldest candidate submitted
| Age | Institution | |
|---|---|---|
| Youngest | 21 | Rada Gminy Bargłów Kościelny |
| Oldest | 83 | Sejmik Województwa Podlaskiego |