Komitet Wyborczy Wyborców Solidarni z Wyborcami
| Name: | Komitet Wyborczy Wyborców Solidarni z Wyborcami | |
| Short name: | KWW Solidarni z Wyborcami | |
| Type of committee: | Election committees established by electors | |
| Address: | ul. Kolejowa 8, 34-470 Czarny Dunajec | |
| Plenipotentiary: | electoral | financial |
| Józef Kazimierz Rafacz | Michał Tomasz Zachemski | |
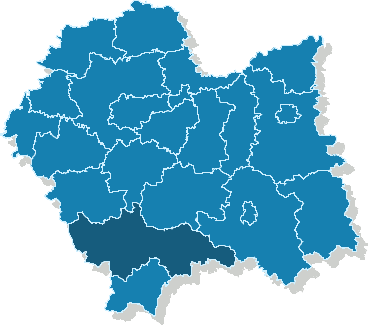
The provinces where the committee has submitted lists of candidates
| Name |
|---|
| pow. nowotarski |
The statistics of election committe
Lists submitted
| Description | Number of |
|---|---|
| Number of lists submitted for province council | 0 |
| Number of lists submitted for county councils | 0 |
| Number of lists submitted for councils of cities holding county rights | 0 |
| Number of lists submitted for districts councils of the cap. city of Warsaw | 0 |
| Number of lists registered for communal councils | 3 |
| Totalling | 3 |
Submitted candidates
| Name | Number of candidates | Women | Women (%) | Men | Men (%) |
|---|---|---|---|---|---|
| Number of candidates submitted for the province council | 0 | 0 | - | 0 | - |
| Number of candidates submitted for county councils | 0 | 0 | - | 0 | - |
| Number of candidates submitted for councils of cities holding county rights | 0 | 0 | - | 0 | - |
| Number of candidates submitted for districts councils of the cap. city of Warsaw | 0 | 0 | - | 0 | - |
| Number of candidates registered for communal councils | 30 | 7 | 23.33% | 23 | 76.67% |
| Number of candidates submitted for reeve, mayor and presidential elections | 1 | 0 | 0.00% | 1 | 100.00% |
| Totalling | 31 | 7 | 22.58% | 24 | 77.42% |
Average age of submitted candidates
| Name | Average age | Average age of women | Average age of men |
|---|---|---|---|
| Average age of candidates submitted for the province council | - | - | - |
| Average age of candidates submitted for county councils | - | - | - |
| Average age of candidates for councils of cities holding county rights | - | - | - |
| Average age of candidates for districts councils of the cap. city of Warsaw | - | - | - |
| Average age of candidates submitted for communal councils | 49 | 47 | 50 |
| Average age of candidates for reeve, mayor, president | 68 | - | 68 |
| Totalling | 50 | 47 | 51 |
Submitted candidates grouped by age
| Name | Number of candidates | Women | Women (%) | Men | Men (%) |
|---|---|---|---|---|---|
| 18-29 | 2 | 0 | 0.00% | 2 | 100.00% |
| 30-39 | 1 | 1 | 100.00% | 0 | 0.00% |
| 40-49 | 13 | 3 | 23.08% | 10 | 76.92% |
| 50-59 | 10 | 3 | 30.00% | 7 | 70.00% |
| 60-69 | 4 | 0 | 0.00% | 4 | 100.00% |
| 70+ | 1 | 0 | 0.00% | 1 | 100.00% |
The youngest and oldest candidate submitted
| Age | Institution | |
|---|---|---|
| Youngest | 28 | Rada Gminy w Czarnym Dunajcu |
| Oldest | 72 | Rada Gminy w Czarnym Dunajcu |