Koalicyjny Komitet Wyborczy SLD+SDPL+PD+UP Lewica i Demokraci
| Name: | Koalicyjny Komitet Wyborczy SLD+SDPL+PD+UP Lewica i Demokraci | |
| Short name: | KKW SLD+SDPL+PD+UP Lewica i Demokraci | |
| Type of committee: | Election committees established by coalitions | |
| Address: | ul. Rozbrat 44a, 00-419 Warszawa | |
| Plenipotentiary: | electoral | financial |
| Michał Tober | Edward Kuczera | |
The provinces where the committee has submitted lists of candidates
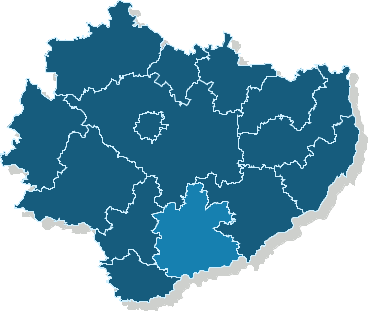
Sejmik Województwa Świętokrzyskiego
Submitted candidates
| Name | Number of candidates | Women | Women (%) | Men | Men (%) | Status |
|---|---|---|---|---|---|---|
| Sum: | 59 | 9 | 15.25% | 50 | 84.75% | |
| Constituency no. 1 | 12 | 1 | 8.33% | 11 | 91.67% |
|
| Constituency no. 2 | 12 | 3 | 25.00% | 9 | 75.00% |
|
| Constituency no. 3 | 12 | 1 | 8.33% | 11 | 91.67% |
|
| Constituency no. 4 | 10 | 1 | 10.00% | 9 | 90.00% |
|
| Constituency no. 5 | 13 | 3 | 23.08% | 10 | 76.92% |
|
Age of the candidates
| Name | Average age | Average age of women | Average age of men | Oldest | Youngest |
|---|---|---|---|---|---|
| Constituency no. 1 | 42 | 25 | 43 | 61 | 21 |
| Constituency no. 2 | 49 | 40 | 52 | 69 | 25 |
| Constituency no. 3 | 47 | 36 | 48 | 69 | 24 |
| Constituency no. 4 | 52 | 53 | 52 | 69 | 26 |
| Constituency no. 5 | 46 | 40 | 47 | 65 | 21 |
The statistics of election committe
Lists submitted
| Description | Number of |
|---|---|
| Number of lists submitted for province council | 5 |
| Number of lists submitted for county councils | 43 |
| Number of lists submitted for councils of cities holding county rights | 5 |
| Number of lists registered for communal councils | 236 |
| Totalling | 289 |
Submitted candidates
| Name | Number of candidates | Women | Women (%) | Men | Men (%) |
|---|---|---|---|---|---|
| Number of candidates submitted for the province council | 59 | 9 | 15.25% | 50 | 84.75% |
| Number of candidates submitted for county councils | 358 | 79 | 22.07% | 279 | 77.93% |
| Number of candidates submitted for councils of cities holding county rights | 56 | 13 | 23.21% | 43 | 76.79% |
| Number of candidates registered for communal councils | 574 | 145 | 25.26% | 429 | 74.74% |
| Number of candidates submitted for reeve, mayor and presidential elections | 18 | 3 | 16.67% | 15 | 83.33% |
| Totalling | 1,065 | 249 | 23.38% | 816 | 76.62% |
Average age of submitted candidates
| Name | Average age | Average age of women | Average age of men |
|---|---|---|---|
| Average age of candidates submitted for the province council | 47 | 39 | 48 |
| Average age of candidates submitted for county councils | 50 | 46 | 51 |
| Average age of candidates for councils of cities holding county rights | 45 | 45 | 45 |
| Average age of candidates submitted for communal councils | 46 | 44 | 47 |
| Average age of candidates for reeve, mayor, president | 48 | 42 | 50 |
| Totalling | 48 | 45 | 48 |
Submitted candidates grouped by age
| Name | Number of candidates | Women | Women (%) | Men | Men (%) |
|---|---|---|---|---|---|
| 18-29 | 100 | 21 | 21.00% | 79 | 79.00% |
| 30-39 | 197 | 63 | 31.98% | 134 | 68.02% |
| 40-49 | 220 | 71 | 32.27% | 149 | 67.73% |
| 50-59 | 355 | 73 | 20.56% | 282 | 79.44% |
| 60-69 | 161 | 20 | 12.42% | 141 | 87.58% |
| 70+ | 32 | 1 | 3.12% | 31 | 96.88% |
The youngest and oldest candidate submitted
| Age | Institution | |
|---|---|---|
| Youngest | 19 | Rada Miasta Skarżysko-Kamienna |
| Oldest | 81 | Rada Miejska w Starachowicach |