Komitet Wyborczy Wyborców "Pilica - Białobrzegi"
| Name: | Komitet Wyborczy Wyborców "Pilica - Białobrzegi" | |
| Short name: | KWW "Pilica - Białobrzegi" | |
| Type of committee: | Election committees established by electors | |
| Address: | ul. 11 Listopada 57, 26-800 Białobrzegi | |
| Plenipotentiary: | electoral | financial |
| Wiesław Kazimierz Rudzki | Elżbieta Zielińska | |
The provinces where the committee has submitted lists of candidates
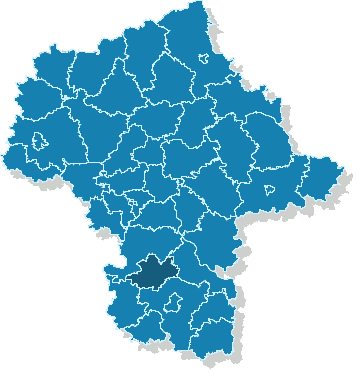
| Name |
|---|
| pow. białobrzeski |
The statistics of election committe
Lists submitted
| Description | Number of |
|---|---|
| Number of lists submitted for province council | 0 |
| Number of lists submitted for county councils | 2 |
| Number of lists submitted for councils of cities holding county rights | 0 |
| Number of lists submitted for districts councils of the cap. city of Warsaw | 0 |
| Number of lists registered for communal councils | 13 |
| Totalling | 15 |
Submitted candidates
| Name | Number of candidates | Women | Women (%) | Men | Men (%) |
|---|---|---|---|---|---|
| Number of candidates submitted for the province council | 0 | 0 | - | 0 | - |
| Number of candidates submitted for county councils | 14 | 3 | 21.43% | 11 | 78.57% |
| Number of candidates submitted for councils of cities holding county rights | 0 | 0 | - | 0 | - |
| Number of candidates submitted for districts councils of the cap. city of Warsaw | 0 | 0 | - | 0 | - |
| Number of candidates registered for communal councils | 13 | 3 | 23.08% | 10 | 76.92% |
| Number of candidates submitted for reeve, mayor and presidential elections | 1 | 0 | 0.00% | 1 | 100.00% |
| Totalling | 28 | 6 | 21.43% | 22 | 78.57% |
Average age of submitted candidates
| Name | Average age | Average age of women | Average age of men |
|---|---|---|---|
| Average age of candidates submitted for the province council | - | - | - |
| Average age of candidates submitted for county councils | 47 | 43 | 48 |
| Average age of candidates for councils of cities holding county rights | - | - | - |
| Average age of candidates for districts councils of the cap. city of Warsaw | - | - | - |
| Average age of candidates submitted for communal councils | 44 | 44 | 44 |
| Average age of candidates for reeve, mayor, president | 55 | - | 55 |
| Totalling | 46 | 43 | 46 |
Submitted candidates grouped by age
| Name | Number of candidates | Women | Women (%) | Men | Men (%) |
|---|---|---|---|---|---|
| 18-29 | 1 | 1 | 100.00% | 0 | 0.00% |
| 30-39 | 6 | 1 | 16.67% | 5 | 83.33% |
| 40-49 | 9 | 2 | 22.22% | 7 | 77.78% |
| 50-59 | 12 | 2 | 16.67% | 10 | 83.33% |
| 60-69 | 0 | 0 | — | 0 | — |
| 70+ | 0 | 0 | — | 0 | — |
The youngest and oldest candidate submitted
| Age | Institution | |
|---|---|---|
| Youngest | 27 | Rada Powiatu Białobrzeskiego |
| Oldest | 57 | Rada Miasta i Gminy Białobrzegi |