Komitet Wyborczy Wyborców WSPÓLNOTA SAMORZĄDOWA POWIATU
| Name: | Komitet Wyborczy Wyborców WSPÓLNOTA SAMORZĄDOWA POWIATU | |
| Short name: | KWW WSPÓLNOTA SAMORZĄDOWA POWIATU | |
| Type of committee: | Election committees established by electors | |
| Address: | Rynek 11, 34-400 Nowy Targ | |
| Plenipotentiary: | electoral | financial |
| Bronisław Bublik | Kazimierz Zapała | |
The provinces where the committee has submitted lists of candidates
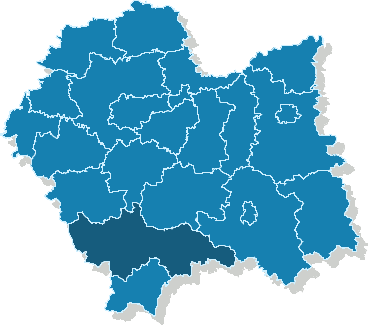
| Name |
|---|
| pow. nowotarski |
The statistics of election committe
Lists submitted
| Description | Number of |
|---|---|
| Number of lists submitted for province council | 0 |
| Number of lists submitted for county councils | 7 |
| Number of lists submitted for councils of cities holding county rights | 0 |
| Number of lists submitted for districts councils of the cap. city of Warsaw | 0 |
| Number of lists registered for communal councils | 7 |
| Totalling | 14 |
Submitted candidates
| Name | Number of candidates | Women | Women (%) | Men | Men (%) |
|---|---|---|---|---|---|
| Number of candidates submitted for the province council | 0 | 0 | - | 0 | - |
| Number of candidates submitted for county councils | 42 | 11 | 26.19% | 31 | 73.81% |
| Number of candidates submitted for councils of cities holding county rights | 0 | 0 | - | 0 | - |
| Number of candidates submitted for districts councils of the cap. city of Warsaw | 0 | 0 | - | 0 | - |
| Number of candidates registered for communal councils | 23 | 8 | 34.78% | 15 | 65.22% |
| Number of candidates submitted for reeve, mayor and presidential elections | 0 | 0 | - | 0 | - |
| Totalling | 65 | 19 | 29.23% | 46 | 70.77% |
Average age of submitted candidates
| Name | Average age | Average age of women | Average age of men |
|---|---|---|---|
| Average age of candidates submitted for the province council | - | - | - |
| Average age of candidates submitted for county councils | 44 | 46 | 44 |
| Average age of candidates for councils of cities holding county rights | - | - | - |
| Average age of candidates for districts councils of the cap. city of Warsaw | - | - | - |
| Average age of candidates submitted for communal councils | 41 | 47 | 38 |
| Average age of candidates for reeve, mayor, president | - | - | - |
| Totalling | 43 | 46 | 42 |
Submitted candidates grouped by age
| Name | Number of candidates | Women | Women (%) | Men | Men (%) |
|---|---|---|---|---|---|
| 18-29 | 10 | 1 | 10.00% | 9 | 90.00% |
| 30-39 | 12 | 3 | 25.00% | 9 | 75.00% |
| 40-49 | 22 | 6 | 27.27% | 16 | 72.73% |
| 50-59 | 15 | 7 | 46.67% | 8 | 53.33% |
| 60-69 | 5 | 2 | 40.00% | 3 | 60.00% |
| 70+ | 1 | 0 | 0.00% | 1 | 100.00% |
The youngest and oldest candidate submitted
| Age | Institution | |
|---|---|---|
| Youngest | 23 | Rada Powiatu Nowotarskiego |
| Oldest | 71 | Rada Powiatu Nowotarskiego |