Komitet Wyborczy Wyborców Młodzi 2006
| Name: | Komitet Wyborczy Wyborców Młodzi 2006 | |
| Short name: | KWW Młodzi 2006 | |
| Type of committee: | Election committees established by electors | |
| Address: | ul. Kilińszczaków 5 m. 4, 78-600 Wałcz | |
| Plenipotentiary: | electoral | financial |
| Sebastian Marcin Romańczyk | Arkadiusz Urbaś | |
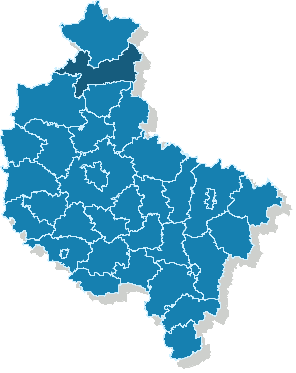
The provinces where the committee has submitted lists of candidates
| Name |
|---|
| pow. pilski |
The statistics of election committe
Lists submitted
| Description | Number of |
|---|---|
| Number of lists submitted for province council | 0 |
| Number of lists submitted for county councils | 0 |
| Number of lists submitted for councils of cities holding county rights | 0 |
| Number of lists registered for communal councils | 7 |
| Totalling | 7 |
Submitted candidates
| Name | Number of candidates | Women | Women (%) | Men | Men (%) |
|---|---|---|---|---|---|
| Number of candidates submitted for the province council | 0 | 0 | - | 0 | - |
| Number of candidates submitted for county councils | 0 | 0 | - | 0 | - |
| Number of candidates submitted for councils of cities holding county rights | 0 | 0 | - | 0 | - |
| Number of candidates registered for communal councils | 9 | 3 | 33.33% | 6 | 66.67% |
| Number of candidates submitted for reeve, mayor and presidential elections | 1 | 0 | 0.00% | 1 | 100.00% |
| Totalling | 10 | 3 | 30.00% | 7 | 70.00% |
Average age of submitted candidates
| Name | Average age | Average age of women | Average age of men |
|---|---|---|---|
| Average age of candidates submitted for the province council | - | - | - |
| Average age of candidates submitted for county councils | - | - | - |
| Average age of candidates for councils of cities holding county rights | - | - | - |
| Average age of candidates submitted for communal councils | 28 | 29 | 28 |
| Average age of candidates for reeve, mayor, president | 47 | - | 47 |
| Totalling | 30 | 29 | 30 |
Submitted candidates grouped by age
| Name | Number of candidates | Women | Women (%) | Men | Men (%) |
|---|---|---|---|---|---|
| 18-29 | 5 | 1 | 20.00% | 4 | 80.00% |
| 30-39 | 4 | 2 | 50.00% | 2 | 50.00% |
| 40-49 | 1 | 0 | 0.00% | 1 | 100.00% |
| 50-59 | 0 | 0 | — | 0 | — |
| 60-69 | 0 | 0 | — | 0 | — |
| 70+ | 0 | 0 | — | 0 | — |
The youngest and oldest candidate submitted
| Age | Institution | |
|---|---|---|
| Youngest | 23 | Rada Gminy Szydłowo |
| Oldest | 47 | - m. Piła |