Komitet Wyborczy Prawo i Sprawiedliwość
| Name: | Komitet Wyborczy Prawo i Sprawiedliwość | |
| Short name: | KW Prawo i Sprawiedliwość | |
| Type of committee: | Election committees established by political parties | |
| Address: | ul. Nowogrodzka 84/86, 02-018 Warszawa | |
| Plenipotentiary: | electoral | financial |
| Tomasz Karusewicz | Teresa Kostrzewska-Gorczyca | |
The provinces where the committee has submitted lists of candidates
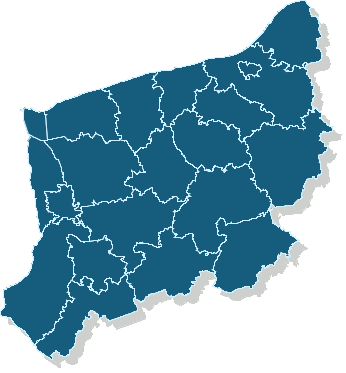
Sejmik Województwa Zachodniopomorskiego
Submitted candidates
| Name | Number of candidates | Women | Women (%) | Men | Men (%) | Status |
|---|---|---|---|---|---|---|
| Sum: | 59 | 14 | 23.73% | 45 | 76.27% | |
| Constituency no. 1 | 16 | 5 | 31.25% | 11 | 68.75% |
|
| Constituency no. 2 | 10 | 3 | 30.00% | 7 | 70.00% |
|
| Constituency no. 3 | 10 | 0 | 0.00% | 10 | 100.00% |
|
| Constituency no. 4 | 10 | 4 | 40.00% | 6 | 60.00% |
|
| Constituency no. 5 | 13 | 2 | 15.38% | 11 | 84.62% |
|
Age of the candidates
| Name | Average age | Average age of women | Average age of men | Oldest | Youngest |
|---|---|---|---|---|---|
| Constituency no. 1 | 47 | 48 | 46 | 60 | 28 |
| Constituency no. 2 | 47 | 51 | 45 | 64 | 27 |
| Constituency no. 3 | 50 | 50 | 56 | 41 | |
| Constituency no. 4 | 50 | 41 | 55 | 65 | 25 |
| Constituency no. 5 | 44 | 47 | 44 | 68 | 20 |
The statistics of election committe
Lists submitted
| Description | Number of |
|---|---|
| Number of lists submitted for province council | 5 |
| Number of lists submitted for county councils | 60 |
| Number of lists submitted for councils of cities holding county rights | 12 |
| Number of lists registered for communal councils | 221 |
| Totalling | 298 |
Submitted candidates
| Name | Number of candidates | Women | Women (%) | Men | Men (%) |
|---|---|---|---|---|---|
| Number of candidates submitted for the province council | 59 | 14 | 23.73% | 45 | 76.27% |
| Number of candidates submitted for county councils | 418 | 113 | 27.03% | 305 | 72.97% |
| Number of candidates submitted for councils of cities holding county rights | 153 | 42 | 27.45% | 111 | 72.55% |
| Number of candidates registered for communal councils | 569 | 216 | 37.96% | 353 | 62.04% |
| Number of candidates submitted for reeve, mayor and presidential elections | 28 | 4 | 14.29% | 24 | 85.71% |
| Totalling | 1,227 | 389 | 31.70% | 838 | 68.30% |
Average age of submitted candidates
| Name | Average age | Average age of women | Average age of men |
|---|---|---|---|
| Average age of candidates submitted for the province council | 47 | 47 | 47 |
| Average age of candidates submitted for county councils | 45 | 42 | 46 |
| Average age of candidates for councils of cities holding county rights | 48 | 46 | 49 |
| Average age of candidates submitted for communal councils | 45 | 44 | 45 |
| Average age of candidates for reeve, mayor, president | 50 | 51 | 50 |
| Totalling | 46 | 44 | 46 |
Submitted candidates grouped by age
| Name | Number of candidates | Women | Women (%) | Men | Men (%) |
|---|---|---|---|---|---|
| 18-29 | 129 | 42 | 32.56% | 87 | 67.44% |
| 30-39 | 208 | 83 | 39.90% | 125 | 60.10% |
| 40-49 | 353 | 123 | 34.84% | 230 | 65.16% |
| 50-59 | 425 | 122 | 28.71% | 303 | 71.29% |
| 60-69 | 93 | 16 | 17.20% | 77 | 82.80% |
| 70+ | 19 | 3 | 15.79% | 16 | 84.21% |
The youngest and oldest candidate submitted
| Age | Institution | |
|---|---|---|
| Youngest | 18 | Rada Miejska w Nowogardzie |
| Oldest | 81 | Rada Powiatu w Białogardzie |