Komitet Wyborczy Samoobrona Rzeczpospolitej Polskiej
| Name: | Komitet Wyborczy Samoobrona Rzeczpospolitej Polskiej | |
| Short name: | KW Samoobrona RP | |
| Type of committee: | Election committees established by political parties | |
| Address: | Al. Jerozolimskie 30, 00-024 Warszawa | |
| Plenipotentiary: | electoral | financial |
| Krzysztof Filipek | Halina Sikorska | |
The provinces where the committee has submitted lists of candidates
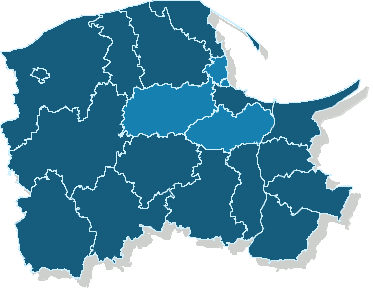
Sejmik Województwa Pomorskiego
Submitted candidates
| Name | Number of candidates | Women | Women (%) | Men | Men (%) | Status |
|---|---|---|---|---|---|---|
| Sum: | 61 | 31 | 50.82% | 30 | 49.18% | |
| Constituency no. 1 | 13 | 4 | 30.77% | 9 | 69.23% |
|
| Constituency no. 2 | 16 | 5 | 31.25% | 11 | 68.75% |
|
| Constituency no. 3 | 14 | 14 | 100.00% | 0 | 0.00% |
|
| Constituency no. 4 | 9 | 4 | 44.44% | 5 | 55.56% |
|
| Constituency no. 5 | 9 | 4 | 44.44% | 5 | 55.56% |
|
Age of the candidates
| Name | Average age | Average age of women | Average age of men | Oldest | Youngest |
|---|---|---|---|---|---|
| Constituency no. 1 | 39 | 40 | 39 | 58 | 20 |
| Constituency no. 2 | 46 | 37 | 51 | 63 | 24 |
| Constituency no. 3 | 39 | 39 | 65 | 21 | |
| Constituency no. 4 | 43 | 41 | 45 | 58 | 23 |
| Constituency no. 5 | 38 | 38 | 38 | 60 | 20 |
The statistics of election committe
Lists submitted
| Description | Number of |
|---|---|
| Number of lists submitted for province council | 5 |
| Number of lists submitted for county councils | 42 |
| Number of lists submitted for councils of cities holding county rights | 9 |
| Number of lists registered for communal councils | 216 |
| Totalling | 272 |
Submitted candidates
| Name | Number of candidates | Women | Women (%) | Men | Men (%) |
|---|---|---|---|---|---|
| Number of candidates submitted for the province council | 61 | 31 | 50.82% | 30 | 49.18% |
| Number of candidates submitted for county councils | 300 | 89 | 29.67% | 211 | 70.33% |
| Number of candidates submitted for councils of cities holding county rights | 88 | 33 | 37.50% | 55 | 62.50% |
| Number of candidates registered for communal councils | 454 | 168 | 37.00% | 286 | 63.00% |
| Number of candidates submitted for reeve, mayor and presidential elections | 20 | 1 | 5.00% | 19 | 95.00% |
| Totalling | 923 | 322 | 34.89% | 601 | 65.11% |
Average age of submitted candidates
| Name | Average age | Average age of women | Average age of men |
|---|---|---|---|
| Average age of candidates submitted for the province council | 41 | 39 | 44 |
| Average age of candidates submitted for county councils | 45 | 42 | 47 |
| Average age of candidates for councils of cities holding county rights | 47 | 43 | 50 |
| Average age of candidates submitted for communal councils | 43 | 40 | 44 |
| Average age of candidates for reeve, mayor, president | 50 | 38 | 51 |
| Totalling | 44 | 41 | 46 |
Submitted candidates grouped by age
| Name | Number of candidates | Women | Women (%) | Men | Men (%) |
|---|---|---|---|---|---|
| 18-29 | 144 | 68 | 47.22% | 76 | 52.78% |
| 30-39 | 192 | 90 | 46.88% | 102 | 53.12% |
| 40-49 | 223 | 67 | 30.04% | 156 | 69.96% |
| 50-59 | 253 | 77 | 30.43% | 176 | 69.57% |
| 60-69 | 93 | 16 | 17.20% | 77 | 82.80% |
| 70+ | 18 | 4 | 22.22% | 14 | 77.78% |
The youngest and oldest candidate submitted
| Age | Institution | |
|---|---|---|
| Youngest | 19 | Rada Gminy Lipnica |
| Oldest | 86 | Rada Miasta Gdańska |