Komitet Wyborczy Prawo i Sprawiedliwość
| Name: | Komitet Wyborczy Prawo i Sprawiedliwość | |
| Short name: | KW Prawo i Sprawiedliwość | |
| Type of committee: | Election committees established by political parties | |
| Address: | ul. Nowogrodzka 84/86, 02-018 Warszawa | |
| Plenipotentiary: | electoral | financial |
| Tomasz Karusewicz | Teresa Kostrzewska-Gorczyca | |
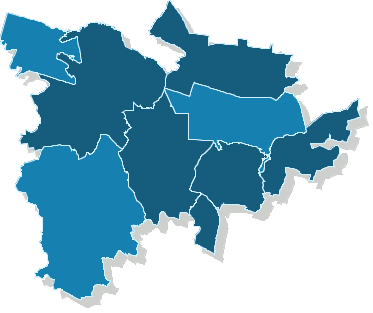
The counties and cities holding county rights where the committee has submitted lists of candidates
| Name |
|---|
| gm. Ożarowice |
| gm. Świerklaniec |
| gm. Tworóg |
| m. Kalety |
| m. Radzionków |
| m. Tarnowskie Góry |
Rada Powiatu Tarnogórskiego
Submitted candidates
| Name | Number of candidates | Women | Women (%) | Men | Men (%) | Status |
|---|---|---|---|---|---|---|
| Sum: | 48 | 10 | 20.83% | 38 | 79.17% | |
| Constituency no. 1 | 10 | 2 | 20.00% | 8 | 80.00% |
|
| Constituency no. 2 | 6 | 2 | 33.33% | 4 | 66.67% |
|
| Constituency no. 3 | 4 | 1 | 25.00% | 3 | 75.00% |
|
| Constituency no. 4 | 6 | 3 | 50.00% | 3 | 50.00% |
|
| Constituency no. 5 | 14 | 1 | 7.14% | 13 | 92.86% |
|
| Constituency no. 6 | 8 | 1 | 12.50% | 7 | 87.50% |
|
Age of the candidates
| Name | Average age | Average age of women | Average age of men | Oldest | Youngest |
|---|---|---|---|---|---|
| Constituency no. 1 | 37 | 39 | 37 | 52 | 25 |
| Constituency no. 2 | 47 | 48 | 47 | 68 | 29 |
| Constituency no. 3 | 32 | 47 | 27 | 47 | 25 |
| Constituency no. 4 | 44 | 36 | 53 | 59 | 28 |
| Constituency no. 5 | 52 | 61 | 52 | 70 | 33 |
| Constituency no. 6 | 43 | 32 | 44 | 60 | 32 |
The statistics of election committe
Lists submitted
| Description | Number of |
|---|---|
| Number of lists submitted for county councils | 6 |
| Number of lists submitted for councils of cities holding county rights | 0 |
| Number of lists registered for communal councils | 20 |
| Totalling | 26 |
Submitted candidates
| Name | Number of candidates | Women | Women (%) | Men | Men (%) |
|---|---|---|---|---|---|
| Number of candidates submitted for county councils | 48 | 10 | 20.83% | 38 | 79.17% |
| Number of candidates submitted for councils of cities holding county rights | 0 | 0 | - | 0 | - |
| Number of candidates registered for communal councils | 80 | 21 | 26.25% | 59 | 73.75% |
| Number of candidates submitted for reeve, mayor and presidential elections | 3 | 0 | 0.00% | 3 | 100.00% |
| Totalling | 131 | 31 | 23.66% | 100 | 76.34% |
Average age of submitted candidates
| Name | Average age | Average age of women | Average age of men |
|---|---|---|---|
| Average age of candidates submitted for county councils | 44 | 42 | 45 |
| Average age of candidates for councils of cities holding county rights | - | - | - |
| Average age of candidates submitted for communal councils | 44 | 44 | 44 |
| Average age of candidates for reeve, mayor, president | 47 | - | 47 |
| Totalling | 44 | 43 | 44 |
Submitted candidates grouped by age
| Name | Number of candidates | Women | Women (%) | Men | Men (%) |
|---|---|---|---|---|---|
| 18-29 | 22 | 4 | 18.18% | 18 | 81.82% |
| 30-39 | 22 | 8 | 36.36% | 14 | 63.64% |
| 40-49 | 35 | 10 | 28.57% | 25 | 71.43% |
| 50-59 | 40 | 6 | 15.00% | 34 | 85.00% |
| 60-69 | 11 | 3 | 27.27% | 8 | 72.73% |
| 70+ | 1 | 0 | 0.00% | 1 | 100.00% |
The youngest and oldest candidate submitted
| Age | Institution | |
|---|---|---|
| Youngest | 19 | Rada Miejska w Tarnowskich Górach |
| Oldest | 70 | Rada Powiatu Tarnogórskiego |