Komitet Wyborczy Wyborców Porozumienie Społeczno-Gospodarcze
| Name: | Komitet Wyborczy Wyborców Porozumienie Społeczno-Gospodarcze | |
| Short name: | KWW Porozumienie Społeczno-Gospodarcze | |
| Type of committee: | Election committees established by electors | |
| Address: | ul. Rzeszowska 10, 37-400 Nisko | |
| Plenipotentiary: | electoral | financial |
| Janusz Andrzej Nawrocki | Danuta Dyba | |
The provinces where the committee has submitted lists of candidates
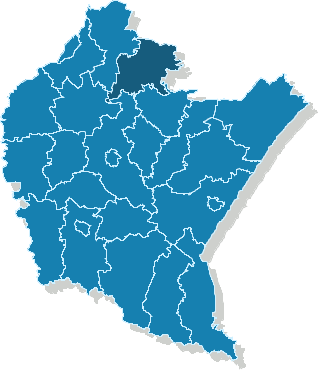
| Name |
|---|
| pow. niżański |
The statistics of election committe
Lists submitted
| Description | Number of |
|---|---|
| Number of lists submitted for province council | 0 |
| Number of lists submitted for county councils | 5 |
| Number of lists submitted for councils of cities holding county rights | 0 |
| Number of lists submitted for districts councils of the cap. city of Warsaw | 0 |
| Number of lists registered for communal councils | 54 |
| Totalling | 59 |
Submitted candidates
| Name | Number of candidates | Women | Women (%) | Men | Men (%) |
|---|---|---|---|---|---|
| Number of candidates submitted for the province council | 0 | 0 | - | 0 | - |
| Number of candidates submitted for county councils | 38 | 10 | 26.32% | 28 | 73.68% |
| Number of candidates submitted for councils of cities holding county rights | 0 | 0 | - | 0 | - |
| Number of candidates submitted for districts councils of the cap. city of Warsaw | 0 | 0 | - | 0 | - |
| Number of candidates registered for communal councils | 102 | 19 | 18.63% | 83 | 81.37% |
| Number of candidates submitted for reeve, mayor and presidential elections | 5 | 0 | 0.00% | 5 | 100.00% |
| Totalling | 145 | 29 | 20.00% | 116 | 80.00% |
Average age of submitted candidates
| Name | Average age | Average age of women | Average age of men |
|---|---|---|---|
| Average age of candidates submitted for the province council | - | - | - |
| Average age of candidates submitted for county councils | 46 | 44 | 47 |
| Average age of candidates for councils of cities holding county rights | - | - | - |
| Average age of candidates for districts councils of the cap. city of Warsaw | - | - | - |
| Average age of candidates submitted for communal councils | 45 | 45 | 46 |
| Average age of candidates for reeve, mayor, president | 49 | - | 49 |
| Totalling | 46 | 45 | 46 |
Submitted candidates grouped by age
| Name | Number of candidates | Women | Women (%) | Men | Men (%) |
|---|---|---|---|---|---|
| 18-29 | 3 | 2 | 66.67% | 1 | 33.33% |
| 30-39 | 30 | 4 | 13.33% | 26 | 86.67% |
| 40-49 | 59 | 12 | 20.34% | 47 | 79.66% |
| 50-59 | 45 | 11 | 24.44% | 34 | 75.56% |
| 60-69 | 6 | 0 | 0.00% | 6 | 100.00% |
| 70+ | 2 | 0 | 0.00% | 2 | 100.00% |
The youngest and oldest candidate submitted
| Age | Institution | |
|---|---|---|
| Youngest | 24 | Rada Miejska w Nisku |
| Oldest | 75 | Rada Miejska w Nisku |