Komitet Wyborczy Konfederacja - Godność i Praca
| Name: | Komitet Wyborczy Konfederacja - Godność i Praca | |
| Short name: | KW Konfederacja - Godność i Praca | |
| Type of committee: | Election committees established by political parties | |
| Address: | ul. Młyńska 21, 40-098 Katowice | |
| Plenipotentiary: | electoral | financial |
| Zygmunt Miernik | Małgorzata Maria Woźniak | |
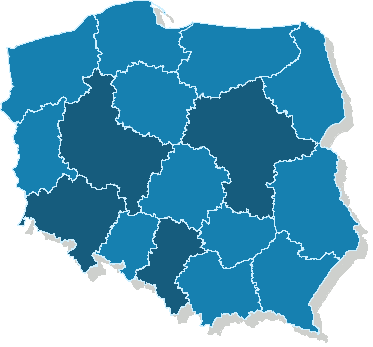
| Name |
|---|
| woj. dolnośląskie |
| woj. mazowieckie |
| woj. śląskie |
| woj. wielkopolskie |
The statistics of election committe
Lists submitted
| Description | Number of |
|---|---|
| Number of lists submitted for province council | 10 |
| Number of lists submitted for county councils | 0 |
| Number of lists submitted for councils of cities holding county rights | 0 |
| Number of lists submitted for districts councils of the cap. city of Warsaw | 0 |
| Number of lists registered for communal councils | 3 |
| Totalling | 13 |
Submitted candidates
| Name | Number of candidates | Women | Women (%) | Men | Men (%) |
|---|---|---|---|---|---|
| Number of candidates submitted for the province council | 90 | 42 | 46.67% | 48 | 53.33% |
| Number of candidates submitted for county councils | 0 | 0 | - | 0 | - |
| Number of candidates submitted for councils of cities holding county rights | 0 | 0 | - | 0 | - |
| Number of candidates submitted for districts councils of the cap. city of Warsaw | 0 | 0 | - | 0 | - |
| Number of candidates registered for communal councils | 3 | 1 | 33.33% | 2 | 66.67% |
| Number of candidates submitted for reeve, mayor and presidential elections | 0 | 0 | - | 0 | - |
| Totalling | 93 | 43 | 46.24% | 50 | 53.76% |
Average age of submitted candidates
| Name | Average age | Average age of women | Average age of men |
|---|---|---|---|
| Average age of candidates submitted for the province council | 46 | 45 | 46 |
| Average age of candidates submitted for county councils | - | - | - |
| Average age of candidates for councils of cities holding county rights | - | - | - |
| Average age of candidates for districts councils of the cap. city of Warsaw | - | - | - |
| Average age of candidates submitted for communal councils | 33 | 46 | 27 |
| Average age of candidates for reeve, mayor, president | - | - | - |
| Totalling | 46 | 45 | 46 |
Submitted candidates grouped by age
| Name | Number of candidates | Women | Women (%) | Men | Men (%) |
|---|---|---|---|---|---|
| 18-29 | 16 | 6 | 37.50% | 10 | 62.50% |
| 30-39 | 13 | 6 | 46.15% | 7 | 53.85% |
| 40-49 | 23 | 12 | 52.17% | 11 | 47.83% |
| 50-59 | 29 | 16 | 55.17% | 13 | 44.83% |
| 60-69 | 7 | 2 | 28.57% | 5 | 71.43% |
| 70+ | 5 | 1 | 20.00% | 4 | 80.00% |
The youngest and oldest candidate submitted
| Age | Institution | |
|---|---|---|
| Youngest | 21 | Sejmik Województwa Dolnośląskiego |
| Oldest | 80 | Sejmik Województwa Dolnośląskiego |